
On This Page
A wind turbine's datasheet gives one power curve. A wind farm never runs on it. Wind shear, air density, wakes from upwind turbines, hot-weather derating and grid curtailment all cut into the energy. Digital twin wind turbine simulation software puts each of those losses on its own gauge.
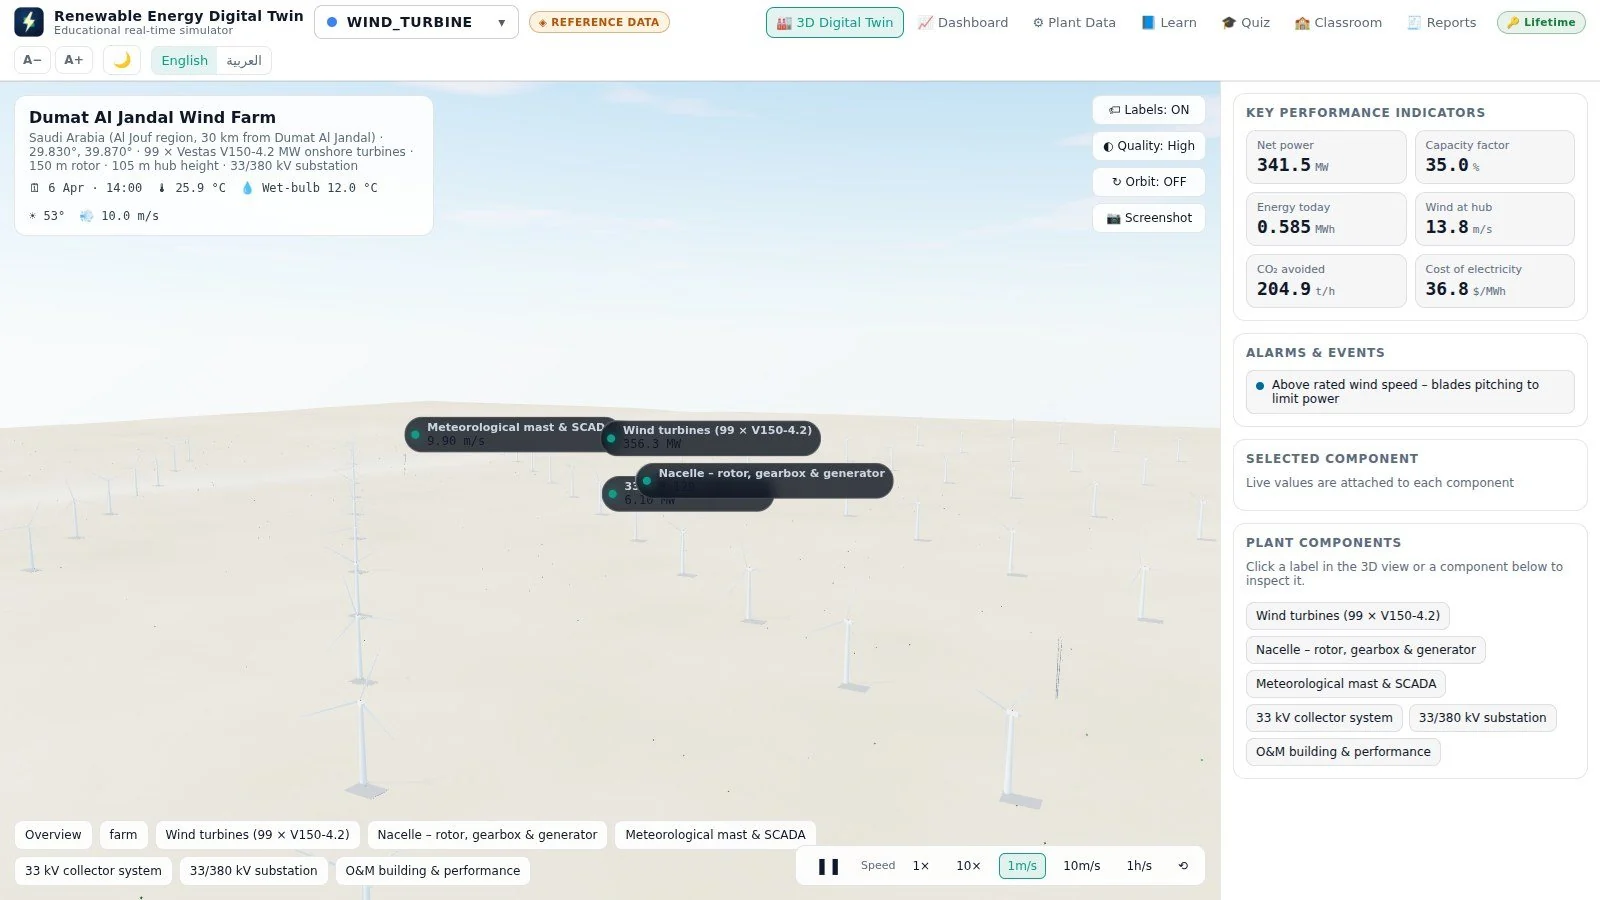
The ASFAN Renewable Energy Digital Twin rebuilds the Dumat Al Jandal Wind Farm in Saudi Arabia, the Kingdom's first utility-scale wind farm, as a live 3D model with 99 turbines, the met mast, the collector system and the substation. The wind at hub height, the power curve and the wake losses are calculated, so changing the wind direction changes the output. This guide is written for universities, technical colleges and training centres in Saudi Arabia. Dumat Al Jandal is in Saudi Arabia, so students in the Kingdom study a wind farm in their own country.
Download the software, brochure and user manual
The Renewable Energy Digital Twin runs on Windows 10 and 11. The trial needs no key, no payment details and no account.
The user manual is also available in Arabic.
What the wind turbine digital twin simulates
The reference plant is the Dumat Al Jandal Wind Farm in Saudi Arabia. Its figures come from the operator’s published data and are shown on the plant data sheet inside the program.
| Operator | EDF Renewables and Masdar (Dumat Al Jandal Wind Company) |
|---|---|
| Commissioned | 2021 – 2022, the first utility-scale wind farm in Saudi Arabia |
| Capacity | 400 MW (99 × Vestas V150-4.2 MW) |
| Technology | 150 m rotor, 105 m hub height, 33/380 kV substation |
The largest wind farm in the Middle East at commissioning produces about 1.4 TWh a year under a record-low tariff of 2.13 US¢/kWh. The twin computes the wind at hub height from the site statistics (wind shear and air density), the turbine power curve with cut-in, rated and cut-out speeds, wake losses that depend on wind direction, hot-weather derating, curtailment, capacity factor, the levelised cost of electricity and avoided CO₂.
Live values on the dashboard
The dashboard shows gauges with limit marks, trend charts over one hour, 24 hours or 31 days, a Sankey energy-flow diagram and the live alarm list. For this plant the main gauges are:
- Net power to grid
- Wind speed at hub height
- Turbines generating
- Rotor power coefficient (Cp)
- 7-day capacity factor
- Levelised cost of electricity
- CO₂ avoided
Scenarios to run in class
Each scenario changes the plant with one click, and every value downstream follows. Run one, let the class predict what will happen, then compare with the twin:
- Typical spring day: the reference wind regime.
- Storm: turbines cut out above 25 m/s and output falls to zero at the height of the wind.
- Calm high-pressure day: low wind and a capacity factor that shows why wind needs a portfolio.
- Sandstorm: blade erosion and dust reduce performance.
- Summer heatwave: thin hot air and derating lower the output at the same wind speed.
- Grid curtailment order (50 %): the grid, not the wind, limits production.
- Repowering (60 × 6.6 MW, 170 m rotors): fewer, larger turbines on the same site.
Plant components you can inspect
Click a label in the 3D view, or a component in the side list, to see its live values and a short description:
- Wind turbines
- Nacelle (rotor, gearbox & generator)
- Meteorological mast & SCADA
- 33 kV collector system
- 33/380 kV substation
- O&M building & performance
What students learn
Each technology comes with its own Learn pages (overview, the process step by step, the key equations, the real plant data sheet, environment and a glossary) and its own quiz bank. Typical learning outcomes:
- Extrapolate wind speed to hub height and explain the effect of air density on power.
- Read a power curve with cut-in, rated and cut-out speeds, and relate it to the Cp gauge.
- Explain wake losses and why wind direction changes a farm's output.
- Calculate capacity factor and levelised cost of electricity, and compare the repowering case.
Quizzes run in practice or timed exam mode, include questions on live data, and print certificates. With a supervisor licence, results from the whole class are collected in a shared folder, with no server needed. For hands-on equipment practice, pair the twin with ASFAN’s VR wind turbine installation training.
Build your own wind turbine plant
Planning a wind farm? Enter the number and type of turbines, hub height and site wind data, and the program builds a 3D twin of your farm and runs the same wind physics on your numbers.
This twin is one of seven in the same program. See the overview of digital twin renewable energy simulation software for the other six plants.
Trial, licences and system requirements
The 14-day trial opens all seven 3D digital twins with live values, camera presets and day/night lighting, every Learn page, both interface languages and simulation speeds up to 10×. A licence unlocks the dashboard, Plant Data and scenarios, the quiz and certificates, reports and data export, the faster simulation speeds, the plant builder and Classroom mode. Licences are monthly or annual and can cover all seven technologies or only the ones you teach; supervisor licences add the Classroom results table.
- Operating system: Windows 10 or 11, 64-bit
- Memory: 4 GB minimum, 8 GB or more recommended
- Graphics: any chip with WebGL 2 (Intel HD 500 series or newer)
- Disk: 600 MB minimum, 1 GB recommended
- Internet: not required; used only for automatic updates and satellite imagery
- User rights: standard user, no administrator password
FAQ: Digital Twin Wind Turbine Simulation Software
What is digital twin wind turbine simulation software?
It is software that rebuilds wind turbines and a wind farm in 3D and drives them with a physics model: hub-height wind, power curve, wakes, derating and curtailment are calculated live. The ASFAN Renewable Energy Digital Twin does this for the Dumat Al Jandal wind farm.
Which turbine model is simulated?
The reference farm uses 99 Vestas V150-4.2 MW turbines with 150 m rotors at 105 m hub height, 400 MW in total.
Does the simulation include wake losses?
Yes. Wake losses depend on wind direction and are part of the farm model, alongside wind shear, air density and hot-weather derating.
Can I simulate a storm or a sandstorm?
Yes. Scenarios include a storm where turbines cut out above 25 m/s, a sandstorm with blade erosion and dust, a heatwave, grid curtailment and repowering with 6.6 MW turbines.
How do I get the wind turbine twin?
Download the 14-day trial for Windows. The Dumat Al Jandal twin and the other six plants open immediately with live values.
Client & Visitor Reviews
Share your experience, feedback, or opinion about this page content.
Write a Review
Latest Reviews