
Arab Power Digital Twin
The digital twin of power generation across the Arab world. More than 620 real power plants in 22 countries — gas, steam, nuclear, solar PV, concentrated solar, wind, hydro, diesel, coal and waste — each one explorable on an offline map, documented on its own page, and runnable as a live 3D simulation. With a complete exam and assessment system for universities on top.
A regional power atlas, a simulator and a gradebook
Built for engineering faculties and training centres that teach power generation in the Arab world — and want the examples to be local ones.
Plant explorer
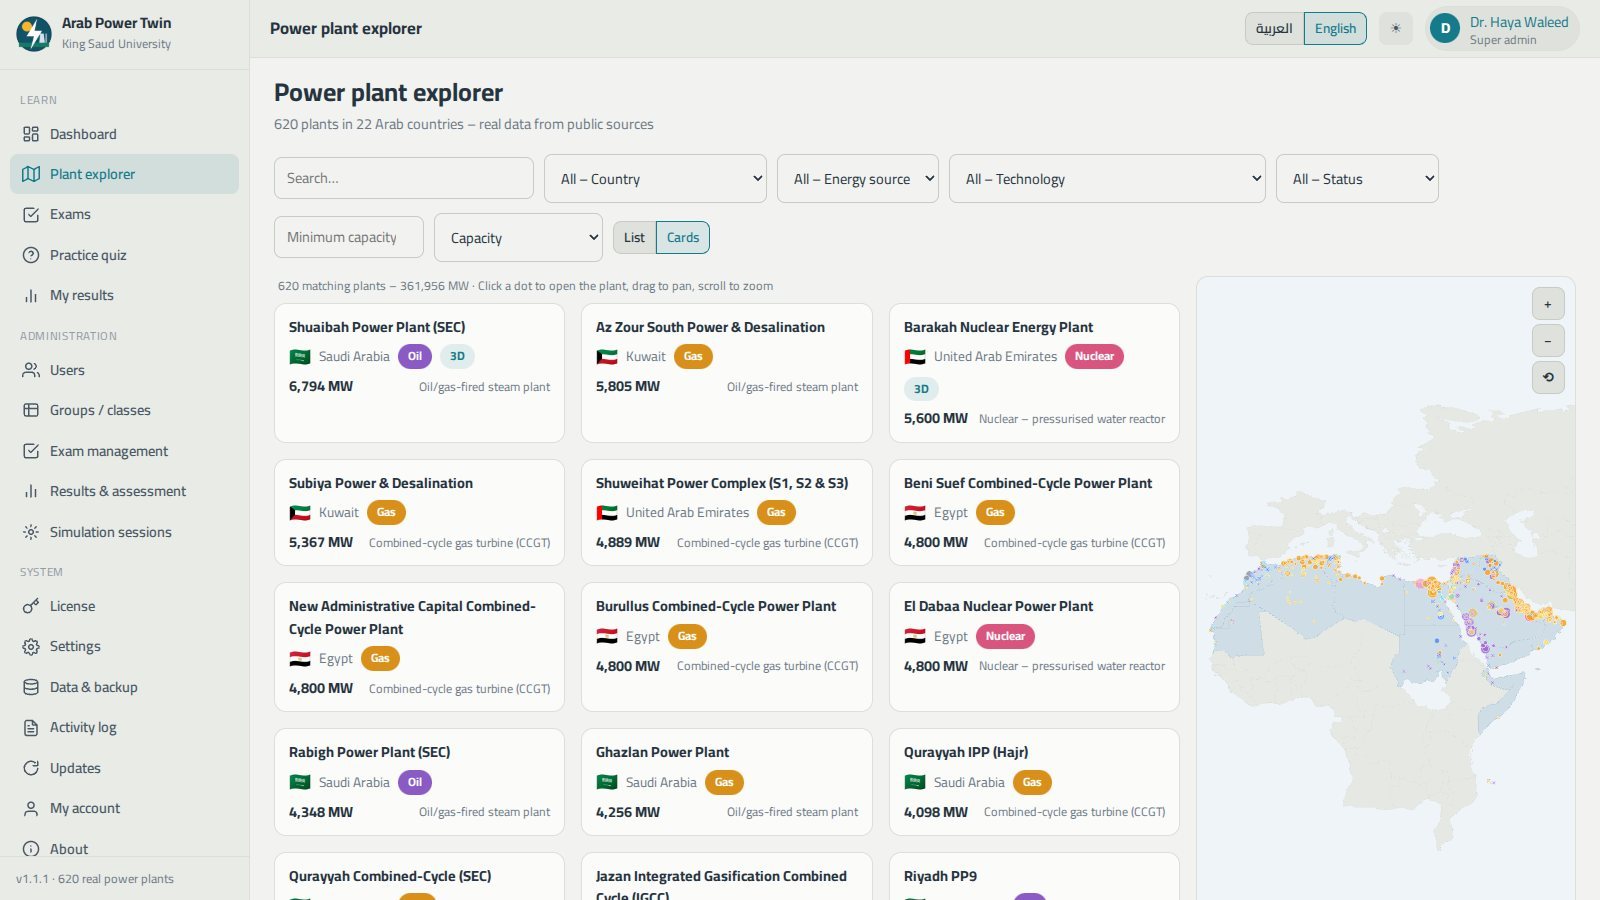
Every plant in a searchable table beside an interactive map of the Arab world that works with no internet, with filters by country, energy source, technology, status and minimum capacity.
Plant pages
Overview, key facts, an explanation of the technology and its components, estimated annual generation, coordinates, the rest of the complex and the nearest plants.
Digital twin
A 3D scene built from the plant's real capacity, unit count, technology and location, driven by a simplified physics simulation with the sun in its true position.
Exams & practice
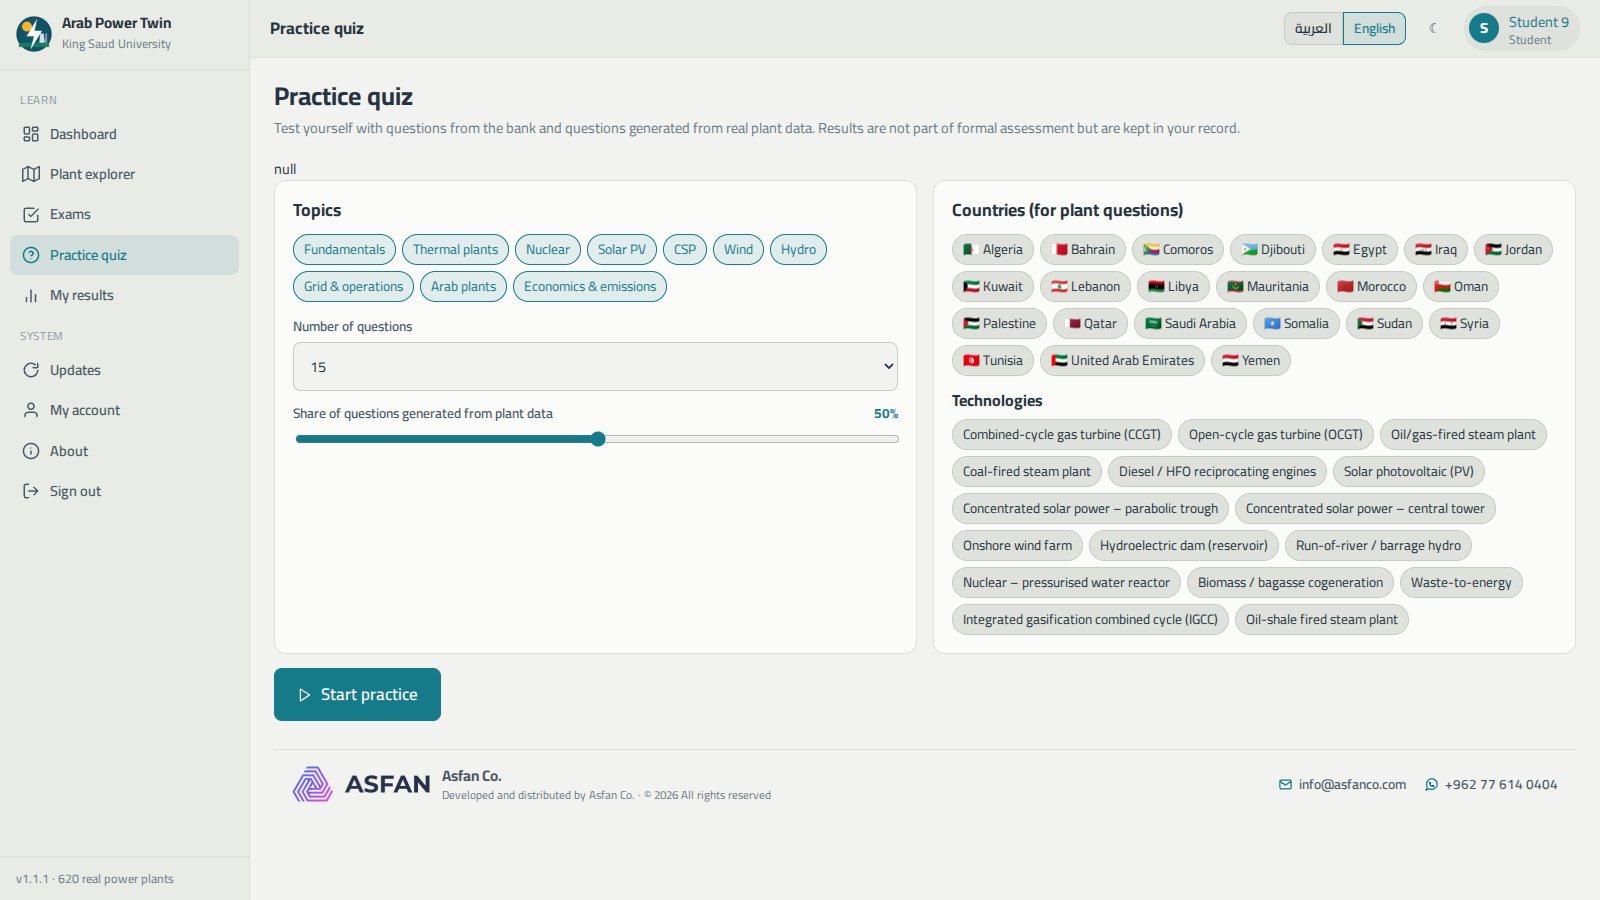
A bilingual question bank plus questions generated from real plant figures, timed formal exams with attempt limits, and informal practice quizzes with instant grading.
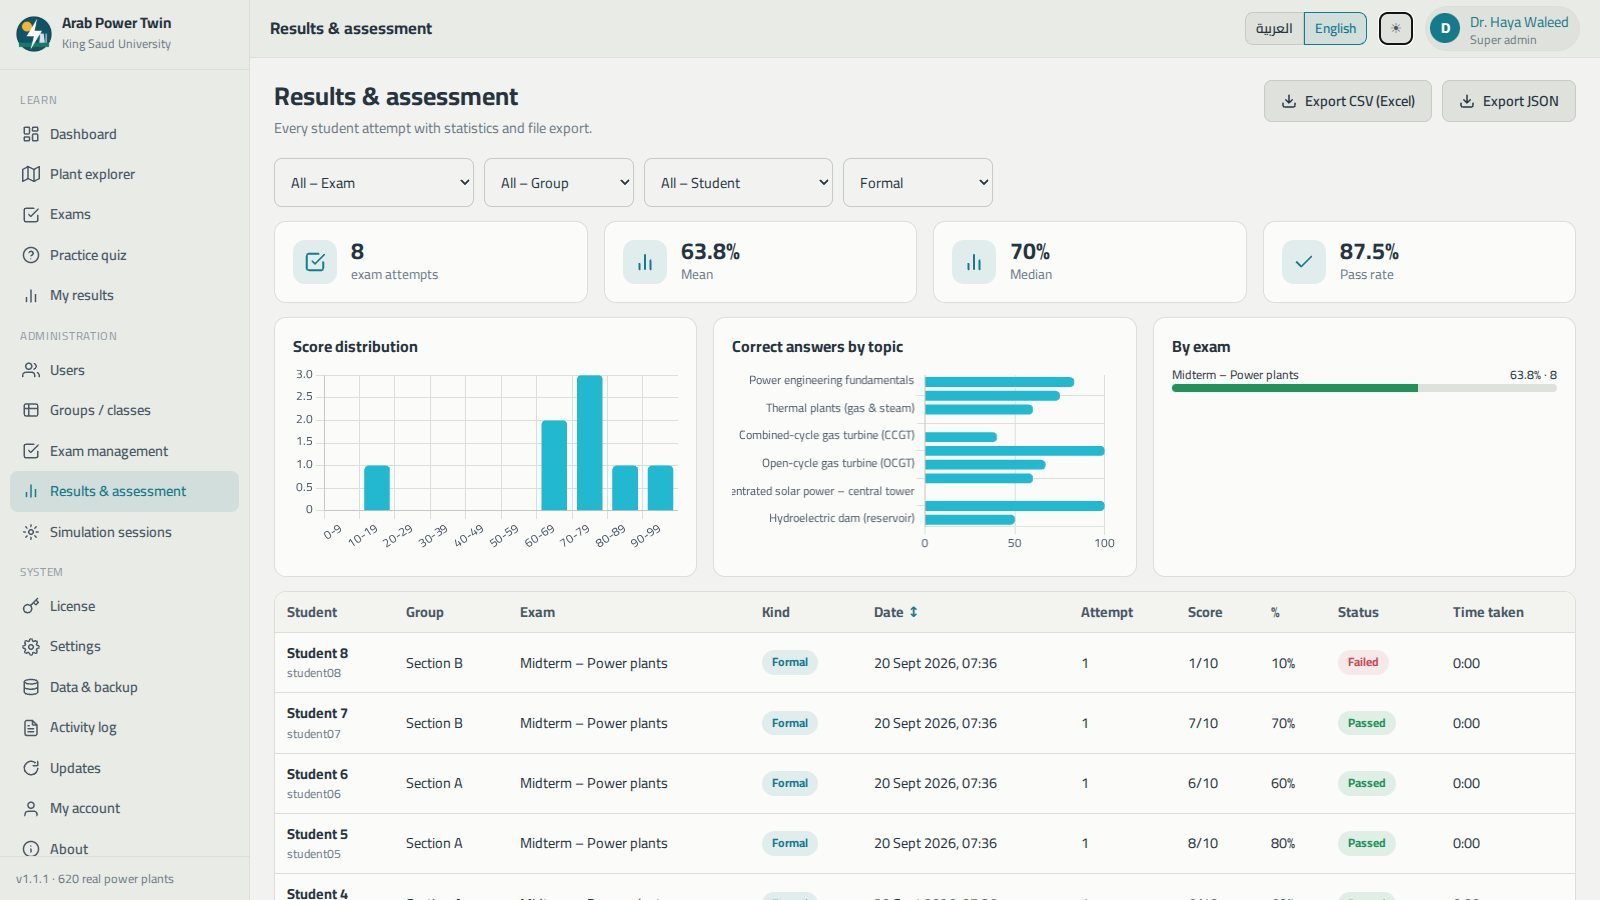
Results & assessment
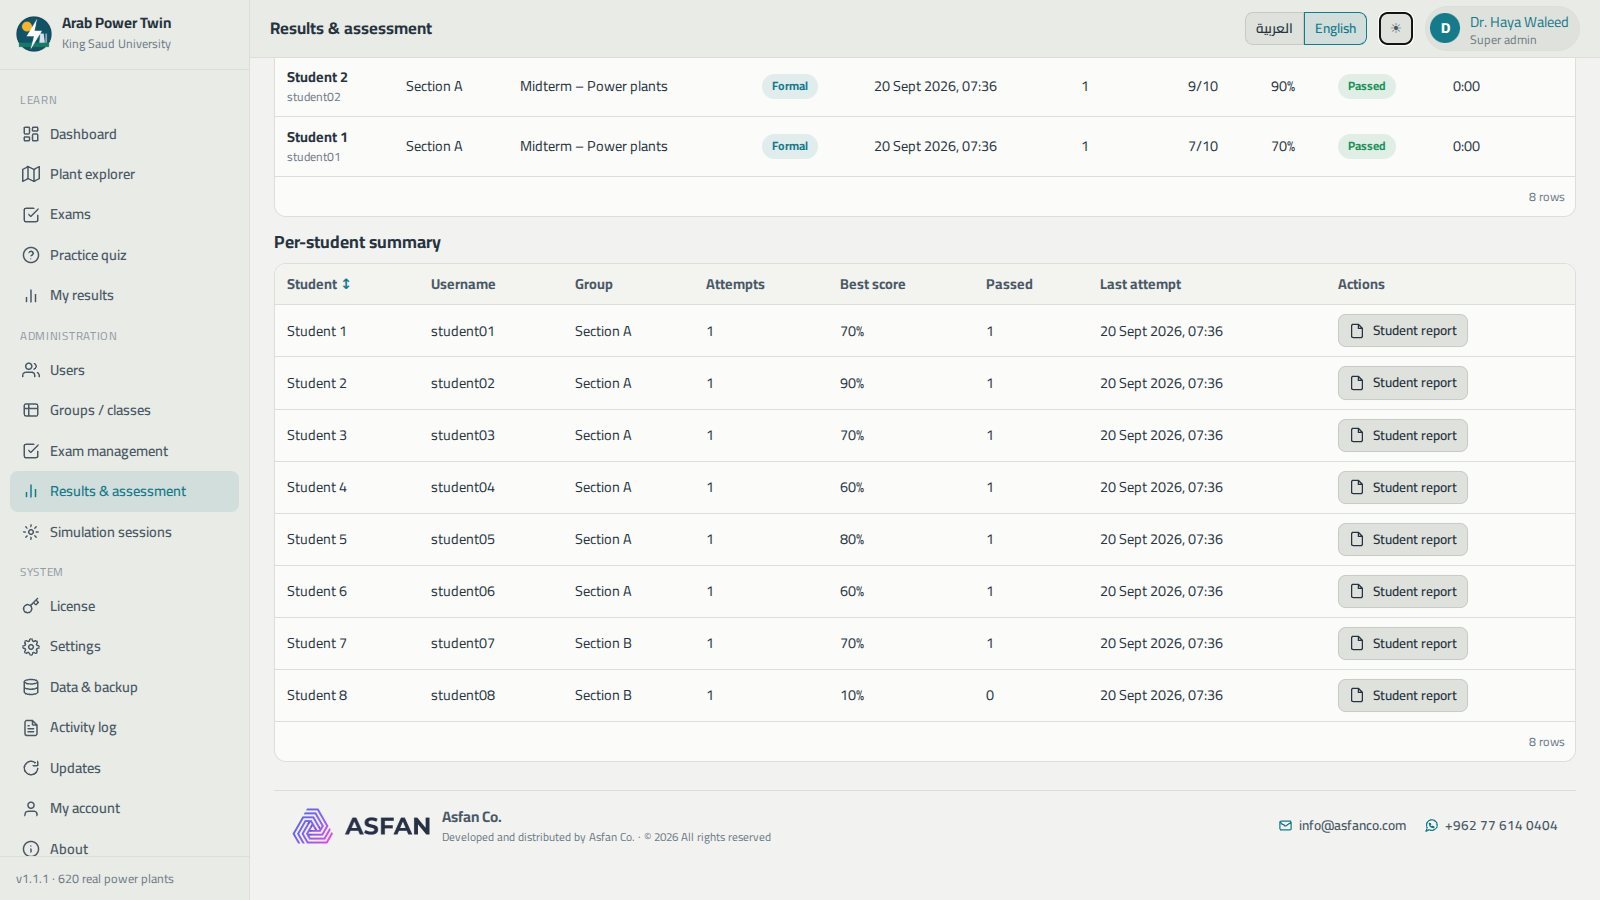
Statistics, score distributions, correct answers by topic, per-student reports, and CSV, JSON and PDF export.
Administration
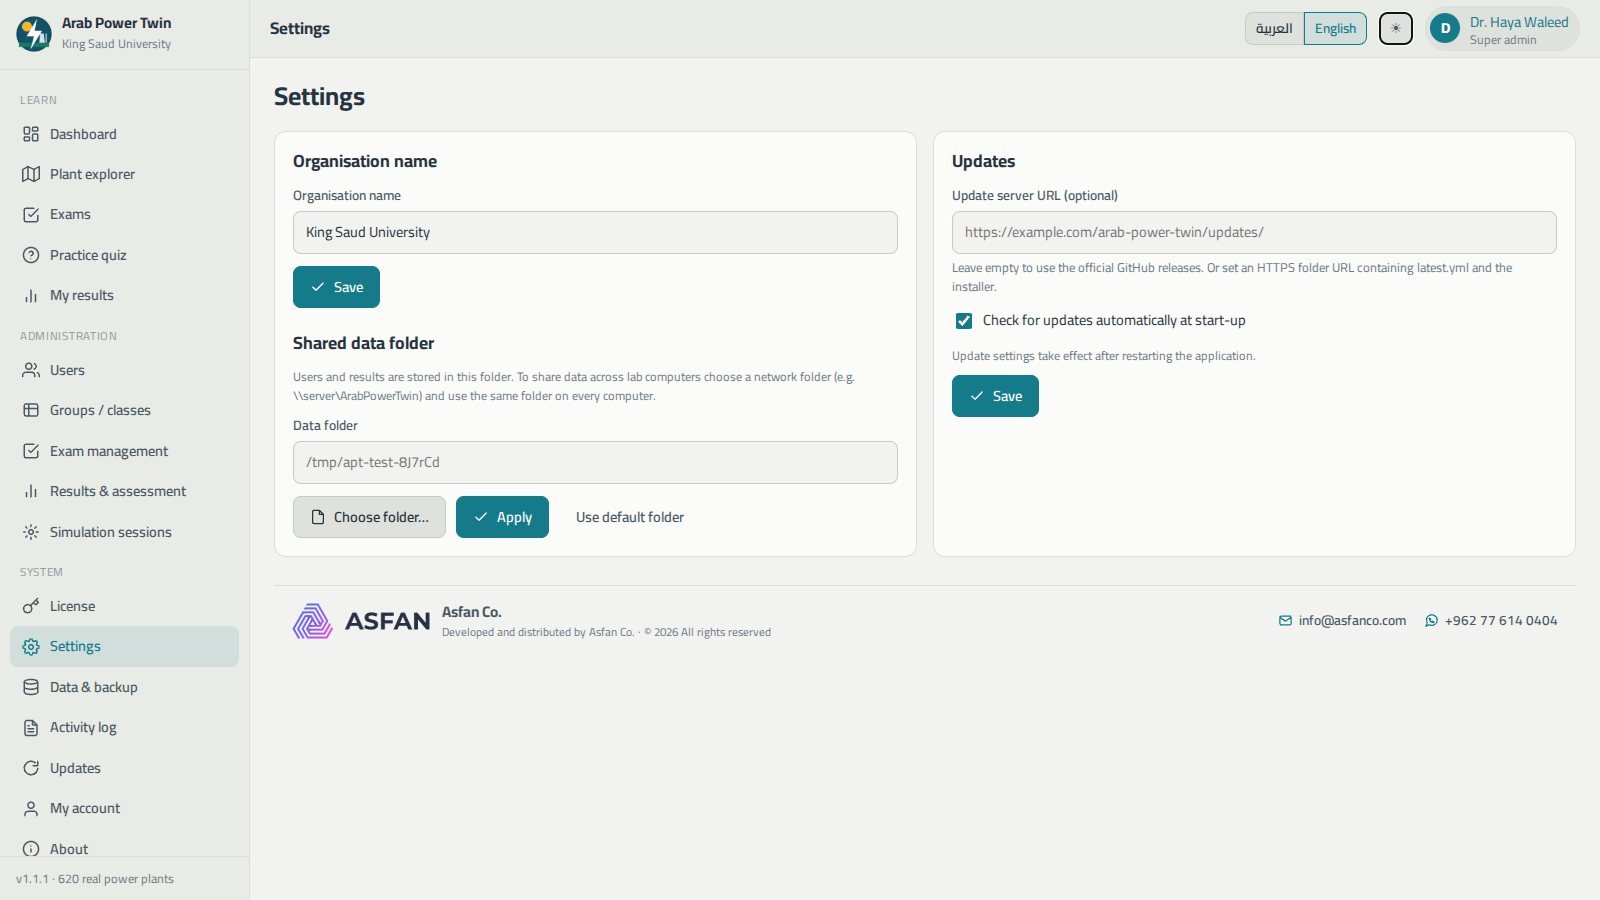
Users and roles, class groups, CSV student import, licensing, a shared data folder for university labs, backups and an activity log.
Every screen, explained
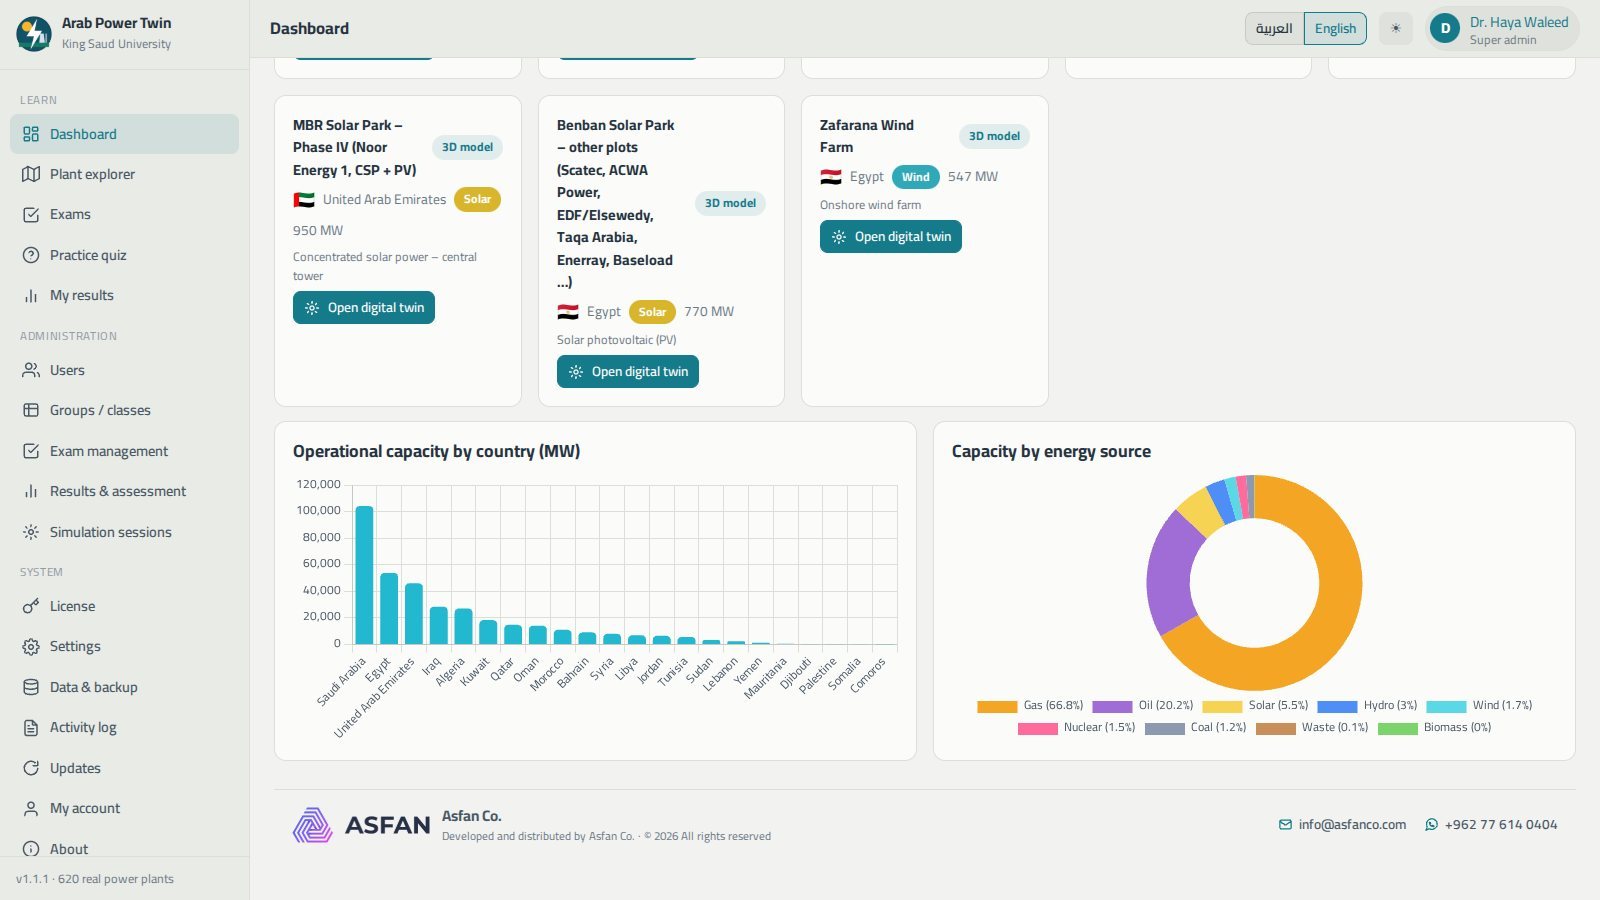
620 plants on one offline map
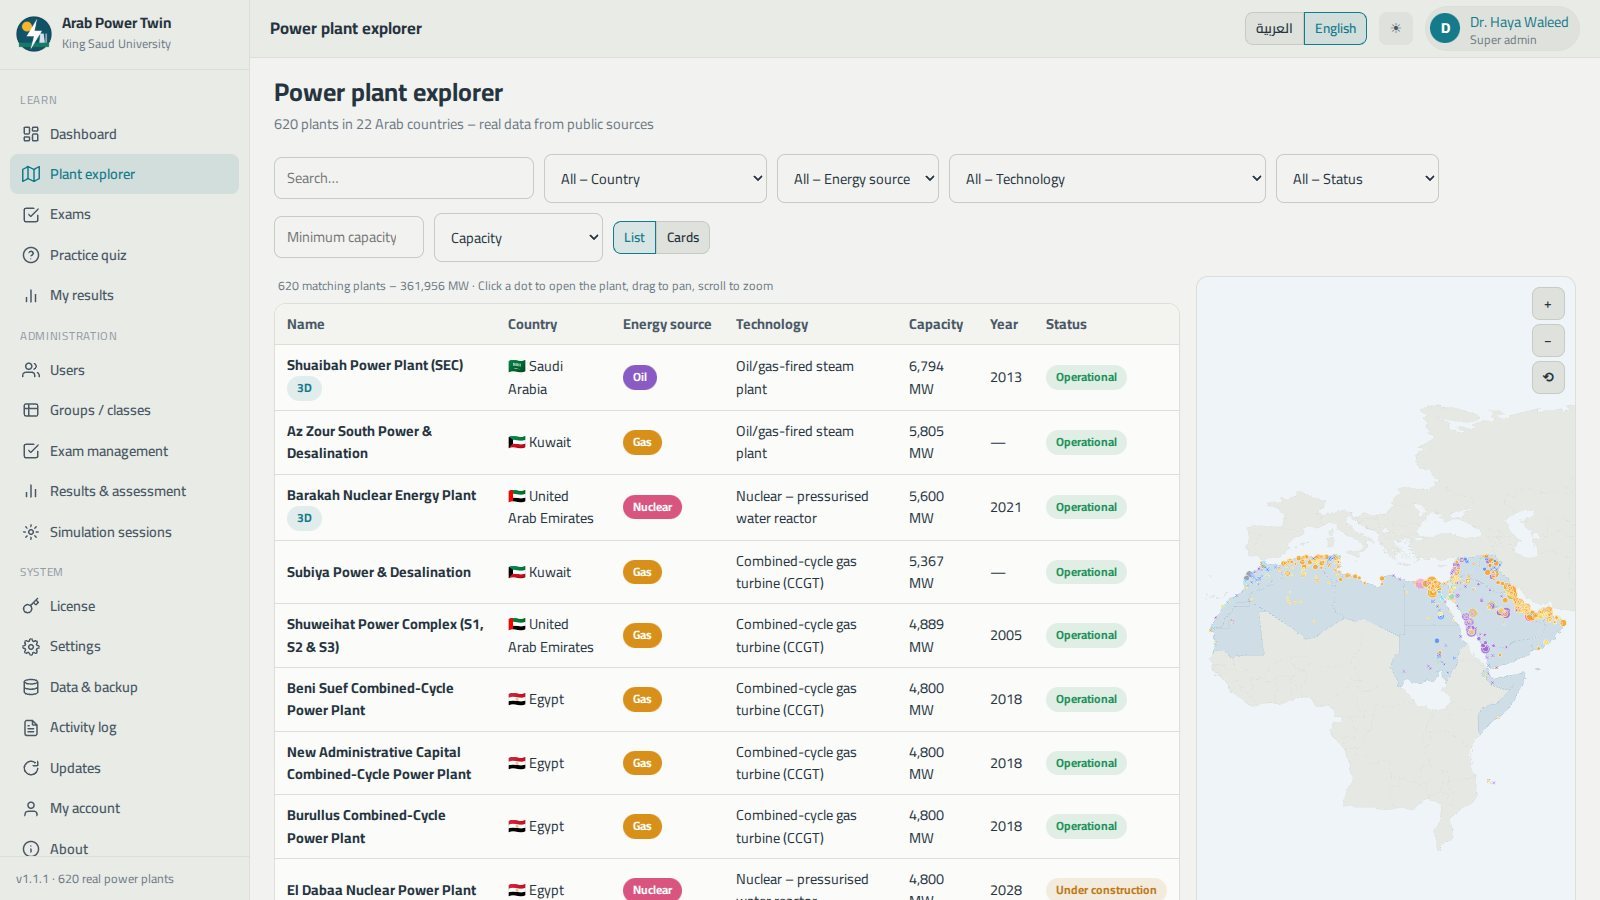
The explorer lists every plant with its name, country, energy source, technology, capacity, commissioning year and status, next to a map of the Arab world where each dot is a plant — coloured by energy source and sized by capacity. It all works without an internet connection.
- Search by part of a plant name in Arabic or English.
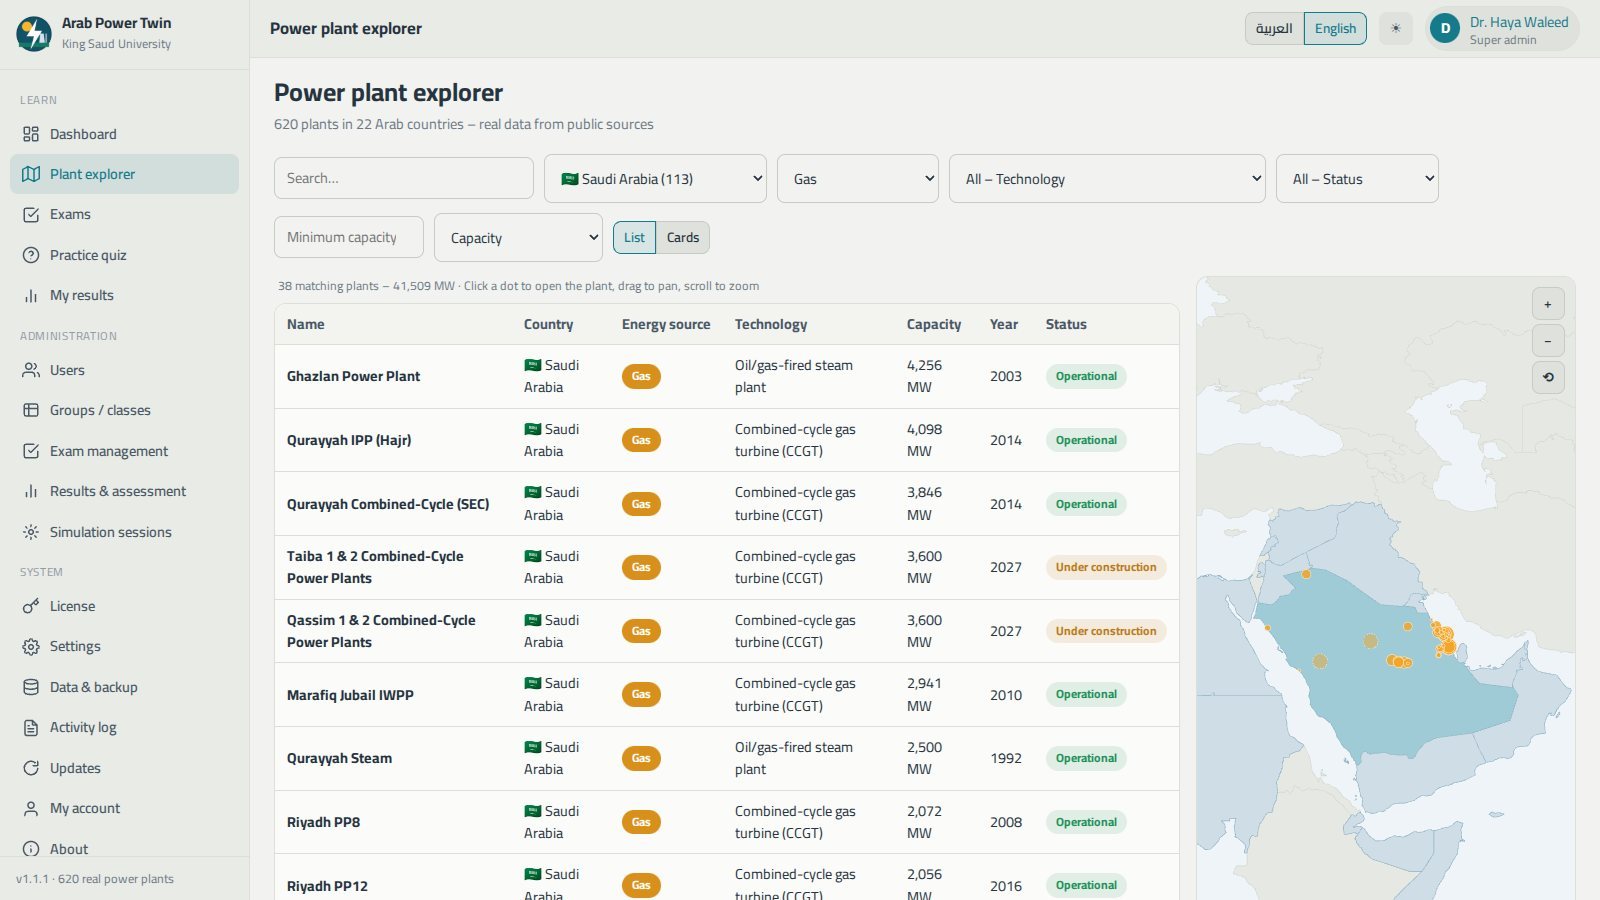
- Filter by country, energy source, technology, status and minimum capacity — the map and the list update together.
- Sort by capacity, name or commissioning year, and switch between a list and a card view.
- A running line shows how many plants match the current filters and their combined capacity.
- Click a dot to open a plant, or click a country to filter the list down to it.
A data sheet for every station
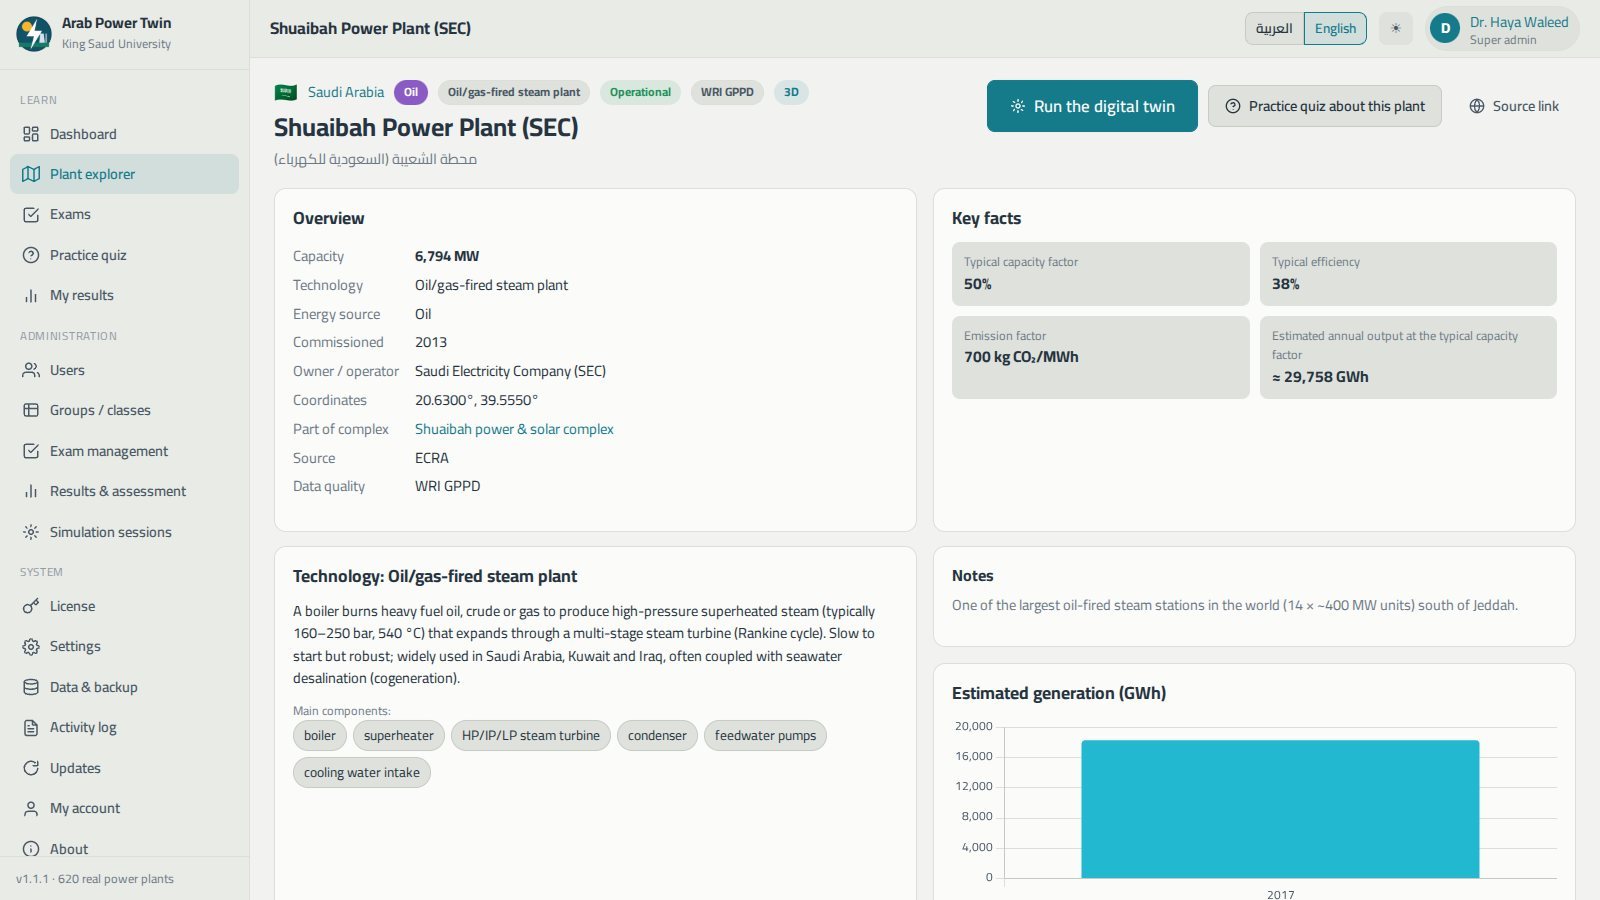
Each plant gets a full page: country, technology, capacity in MW, status, commissioning year, owner or operator and the quality of the data behind it — verified, WRI GPPD or approximate.
- Key facts: typical efficiency, typical capacity factor, emission factor, recorded or estimated annual generation in GWh, and coordinates.
- A plain explanation of how that technology works and what its main components are.
- Notes about the plant and a link to the original data source.
- The rest of the complex, when the plant belongs to one like Jebel Ali or Ras Laffan, and the nearest plants with distances in km.
- Two buttons at the top: run the digital twin, or start a practice quiz generated from this plant's own data.
Run a real Arab power station
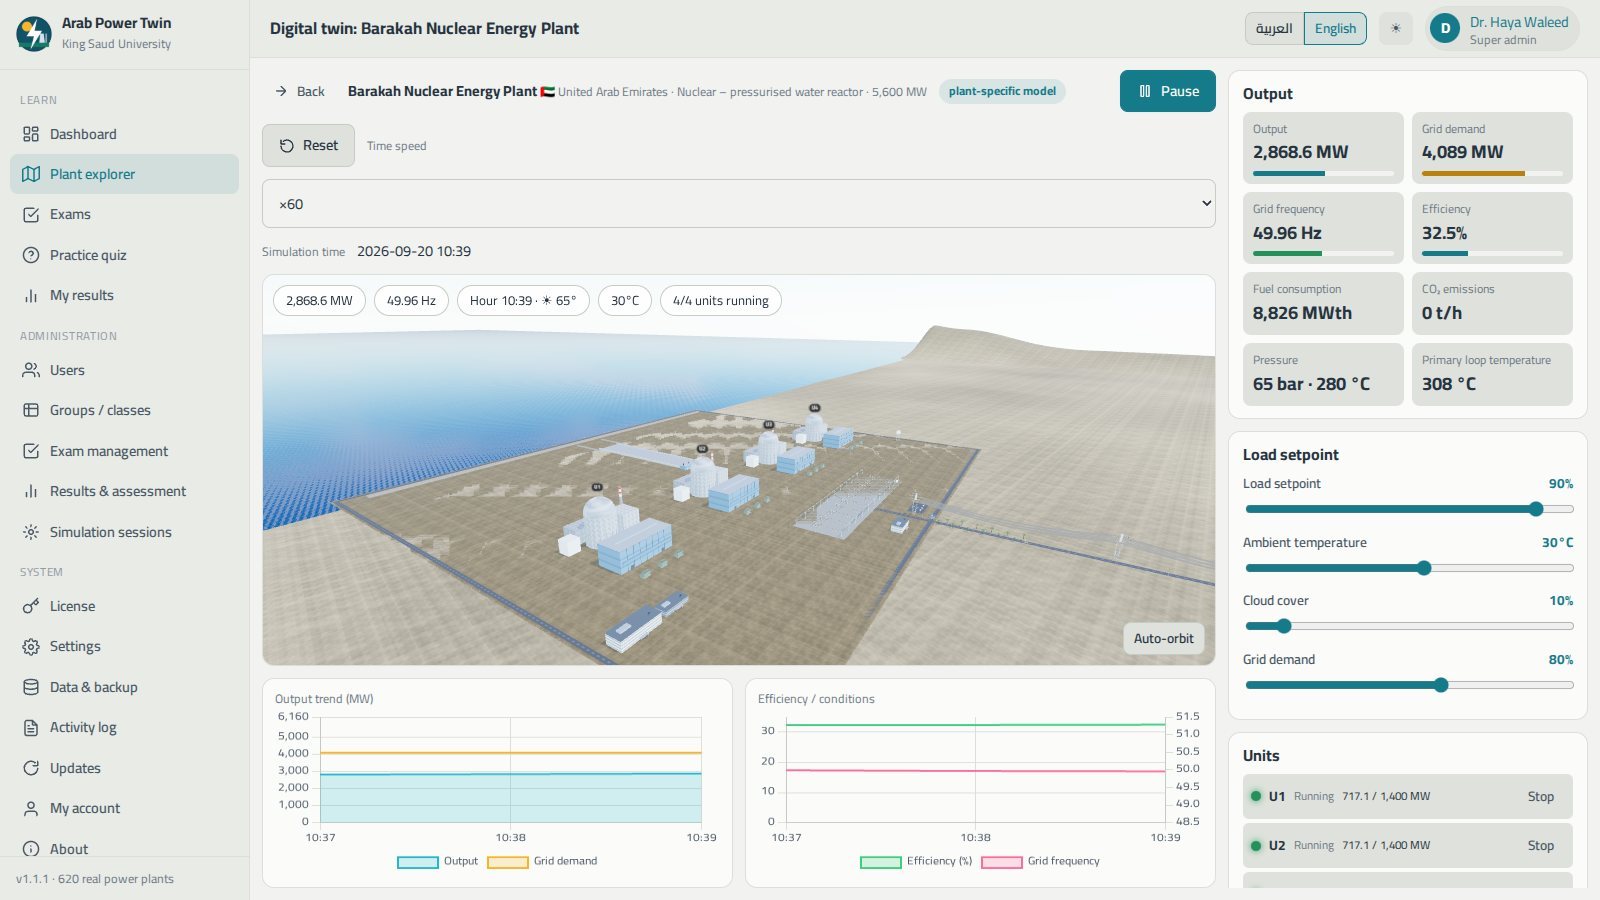
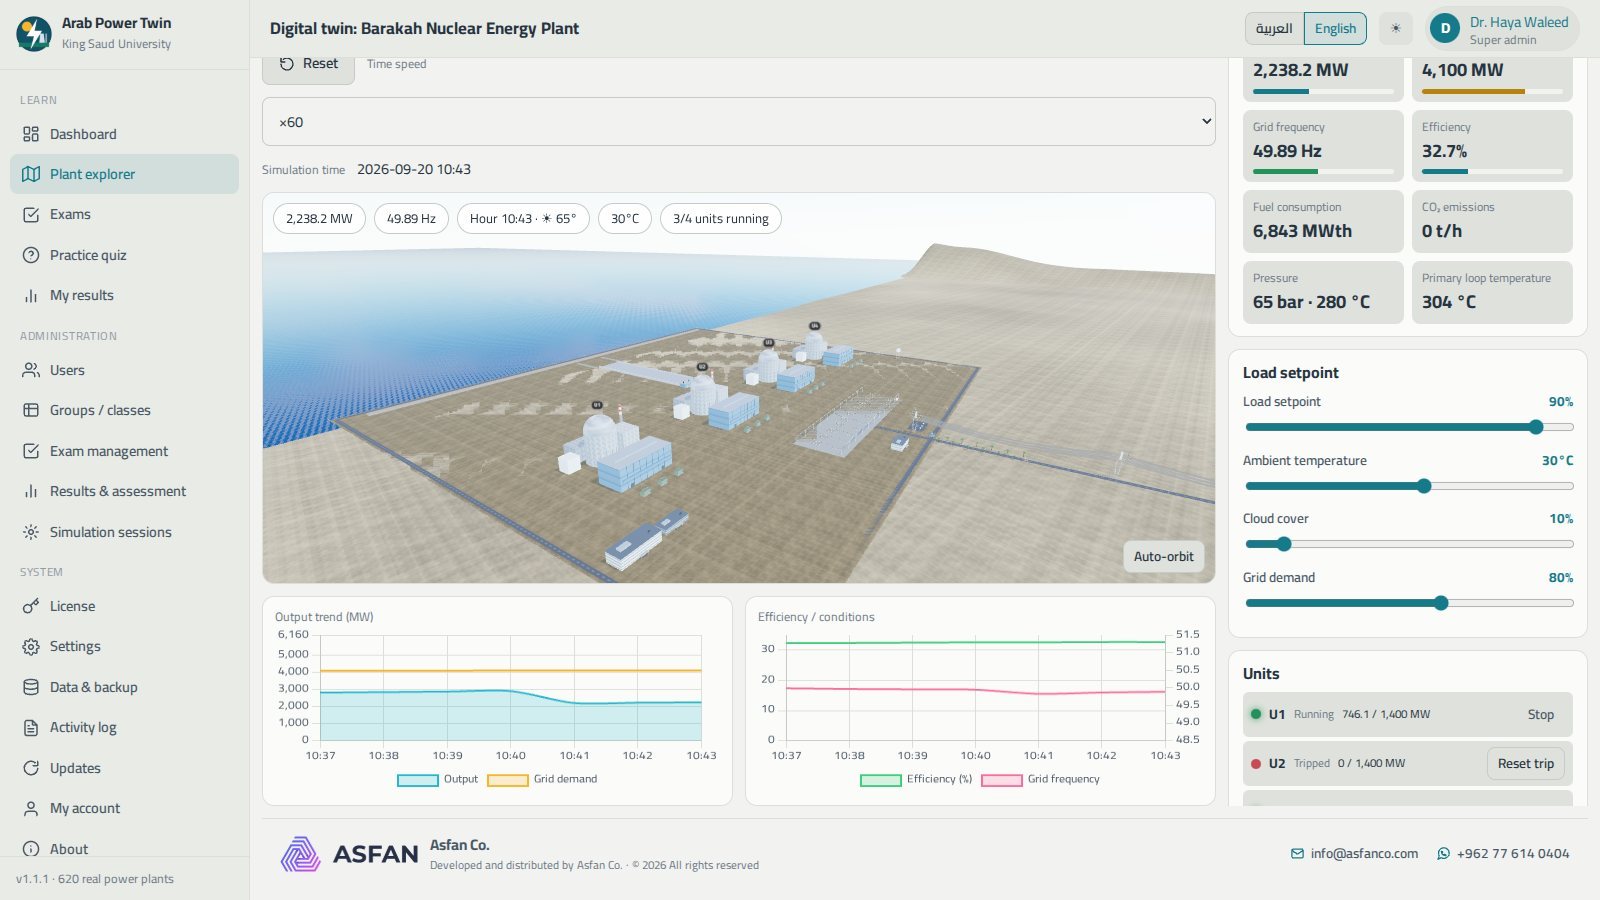
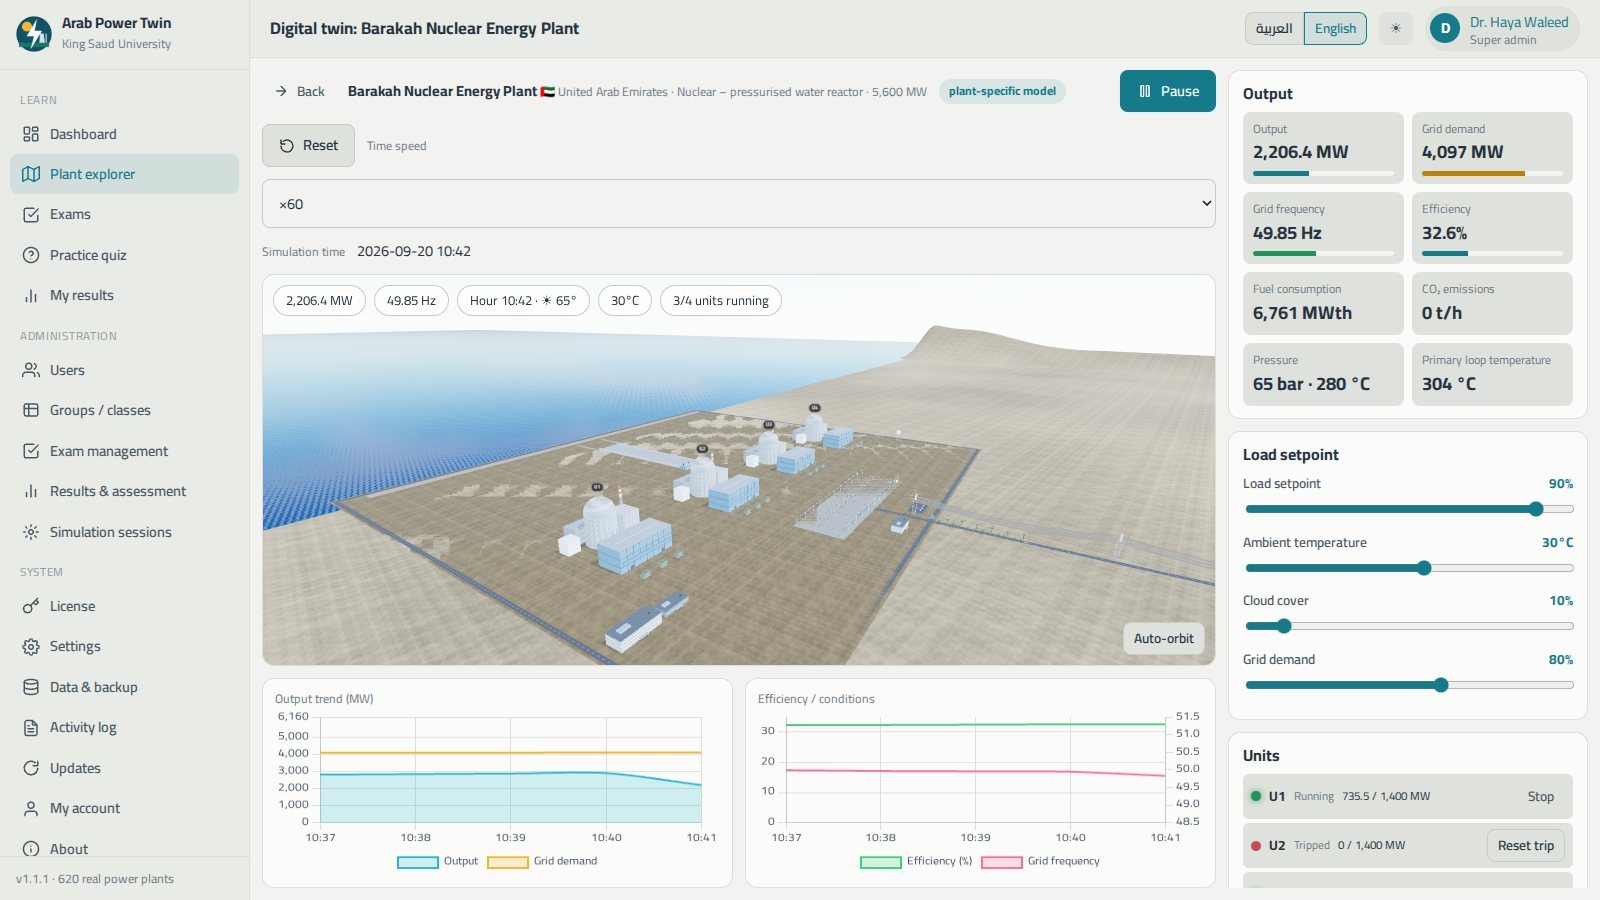
The heart of the program. The 3D scene is built from the plant's actual capacity, number of units, technology and location, and driven by a simplified physics model in real time or at up to 1800× speed. The lighting follows the sun's true position for that site, windows light up at night, chimney plumes rise, rotors and fans turn, and panels and mirrors track the sun.
- Live indicators: output in MW, grid demand, grid frequency and efficiency — plus technology-specific values such as fuel consumption and CO₂ for thermal plants, reactor thermal power and primary-loop temperature for nuclear, irradiance and cell temperature for solar, wind and rotor speed for wind, reservoir level and discharge for hydro.
- Controls for the load setpoint, ambient temperature, cloud cover, dust, wind speed and grid demand — plus a "clean the panels" option for solar plants.
- A unit list showing each unit's state — running, starting, stopping, off or tripped — with buttons to start, stop and reset a trip.
- A sea for coastal plants, terrain for inland ones, and a badge saying whether the model is plant-specific or generic for the technology.
Break the plant on purpose, then watch it recover
One click applies a training event: a sudden unit trip, a 48 °C heatwave, a dust storm, a strong wind gust or a surge in demand. The indicators and alarms respond exactly as you would expect them to, and "Clear scenario" returns the plant to normal.
- Alarms and events with their simulation time: frequency deviation, high vibration, high exhaust temperature, soiling, wind above cut-out, a full or low reservoir, start-up, synchronisation and trip messages.
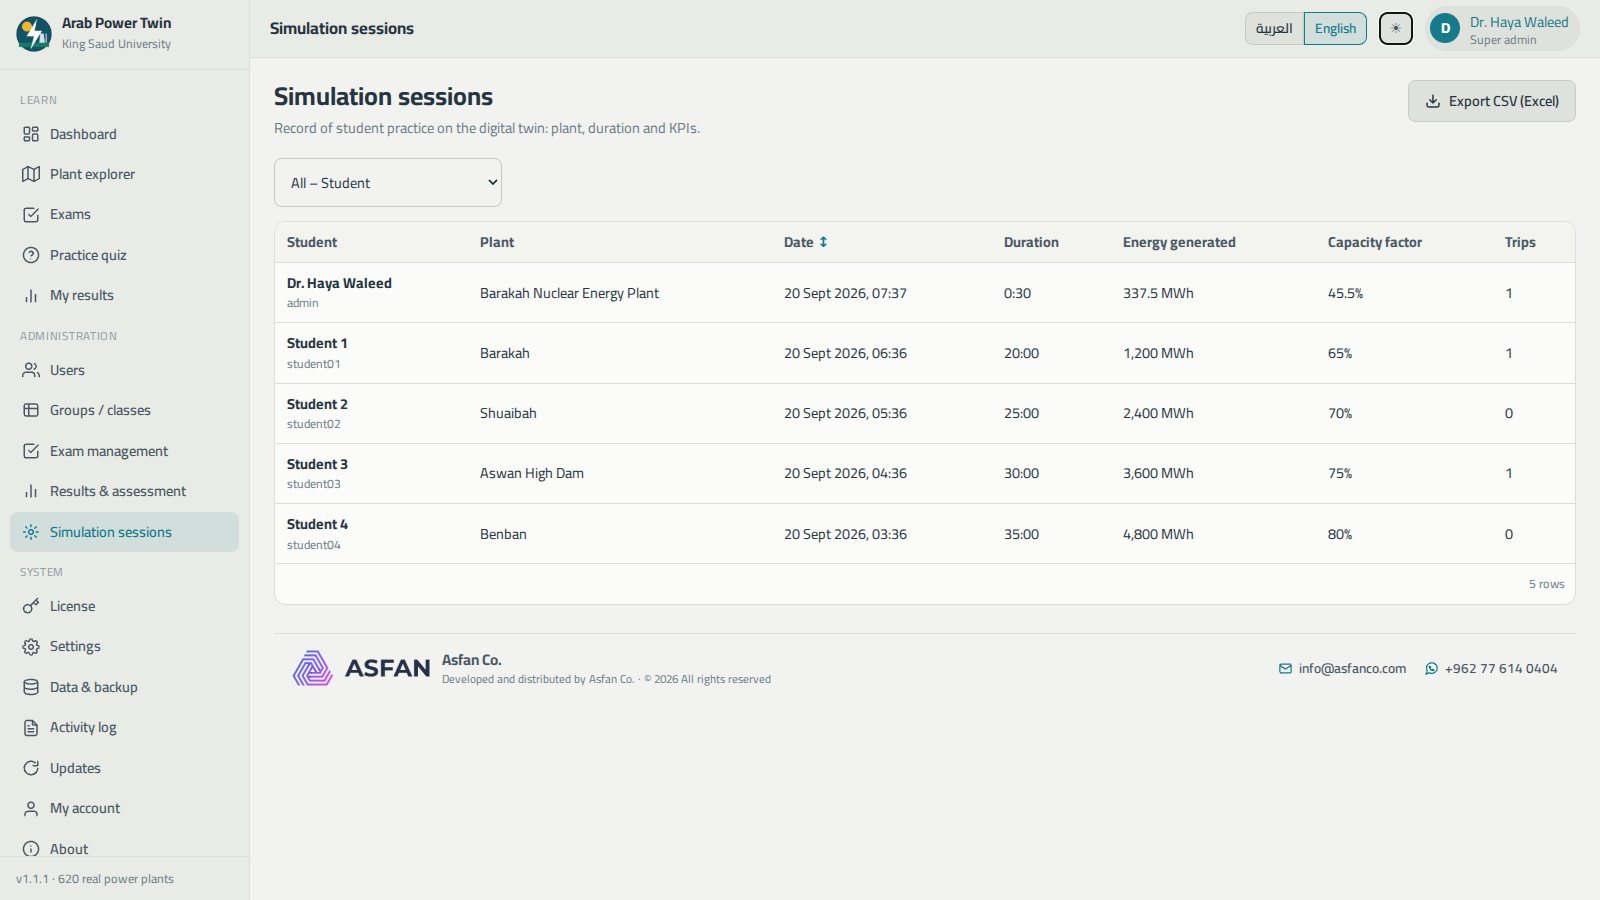
- Session KPIs: energy delivered, session capacity factor, availability, number of trips and cumulative fuel and CO₂.
- End session & save report stores the whole session in the student's record; leaving the page after twenty seconds saves it automatically.
- Instructors then review every session on the Simulation sessions page — which makes operating skill itself assessable.
Two question sources, one gradebook
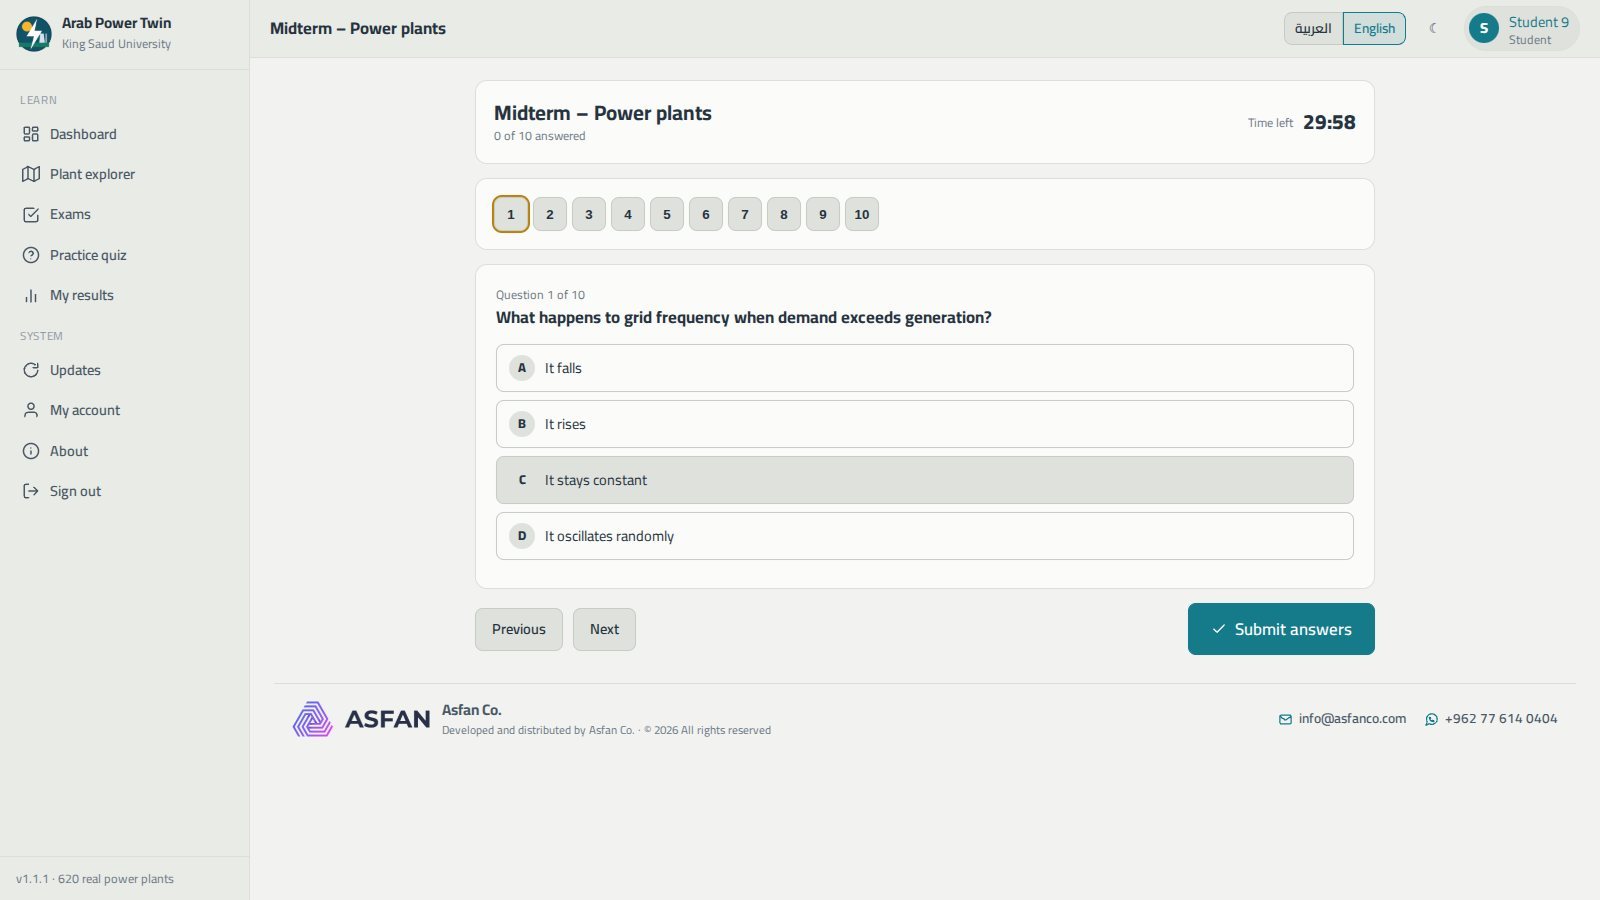
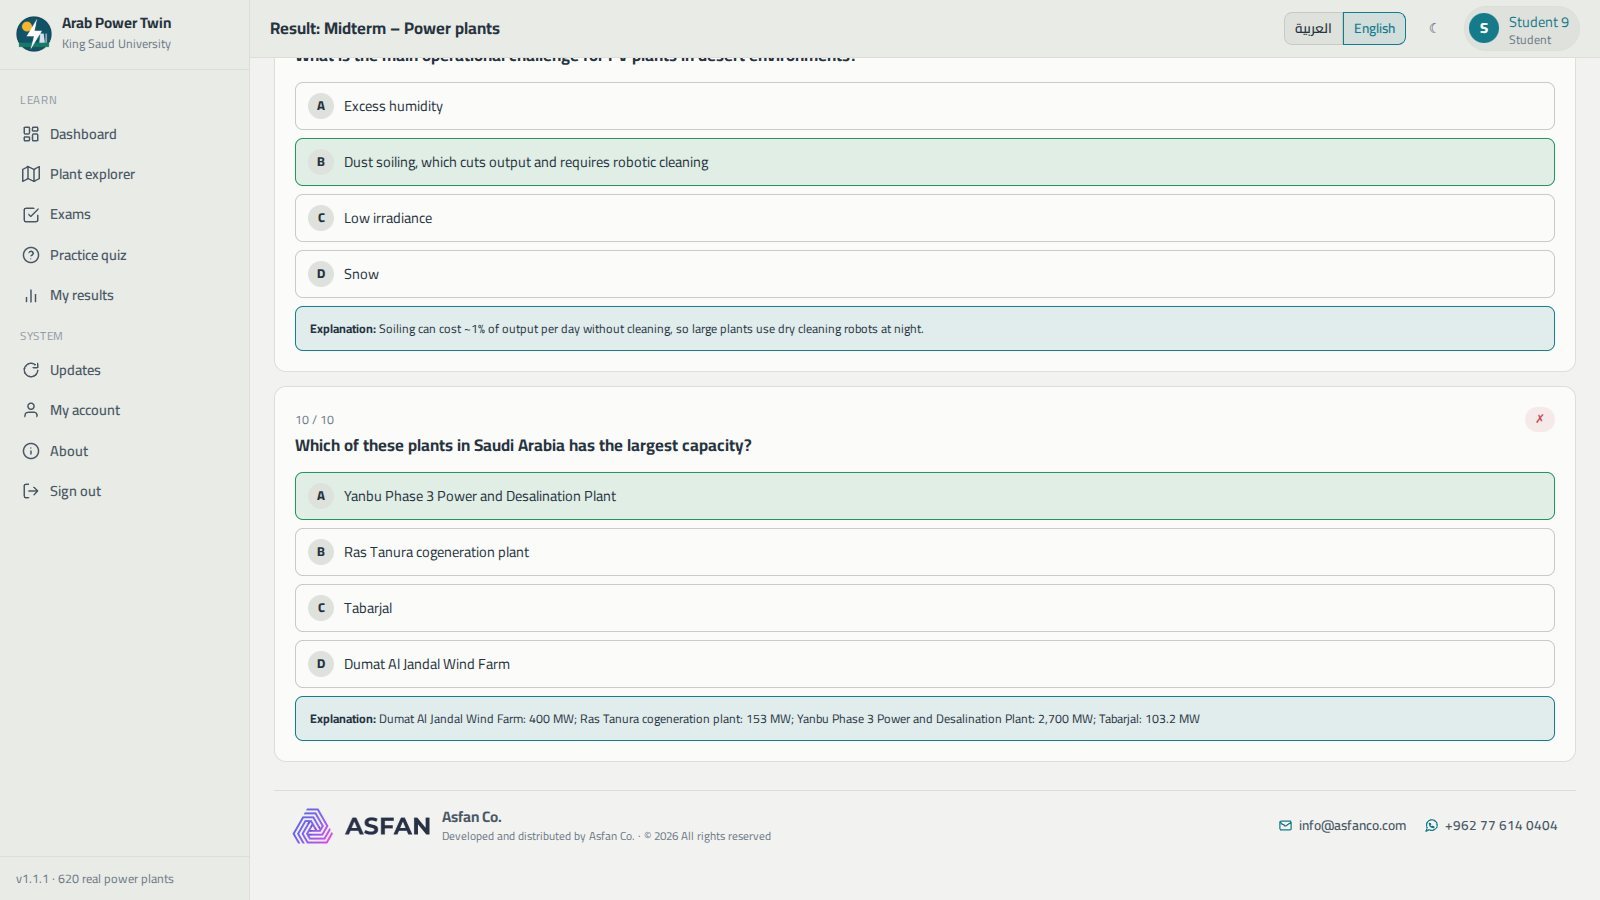
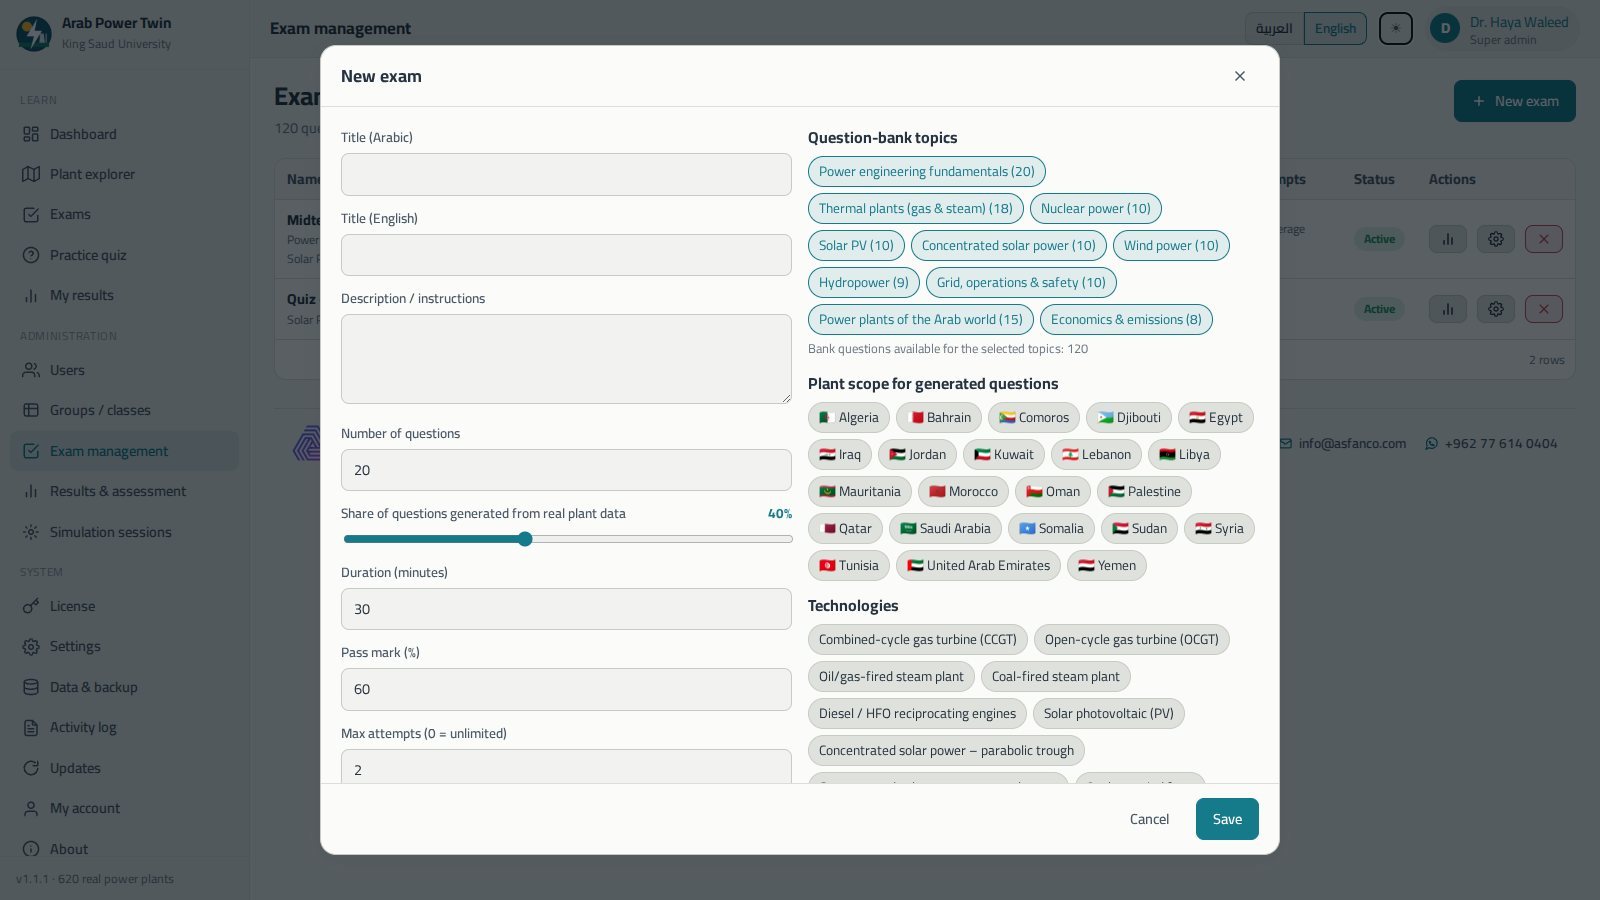
Formal exams are assigned to class groups with a timer, a pass mark and an attempt limit. Alongside the bilingual question bank of ten topics, the program generates questions from the real plant database — capacity, country, technology, commissioning year, and energy, fuel and emission calculations — so every cohort gets fresh, factual questions.
- Every student receives a different order of questions and options from the same specification.
- Answers save automatically — close the program and resume where you stopped, as long as time remains.
- Correct answers are never sent to the student's computer before submission.
- The result shows the score, the percentage, pass or fail, the time taken and performance by topic — with a full answer review and explanations when the instructor allows it.
- A certificate or PDF report can be printed from any result.
The whole cohort on one page
Every attempt by every student in one place. Filter by exam, group, student or kind — formal or practice — and the statistics update with it: number of attempts, mean, median and pass rate.
- Charts of the score distribution, the share of correct answers by topic, and the average by exam.
- A per-student summary with attempts, best score and last attempt, and a Student report button that prints a PDF of their results and simulation sessions.
- Export the filtered table as CSV — which opens in Excel with Arabic intact — or as JSON.
- Click any row to open the full detail of that attempt.
Set up a whole faculty in an afternoon
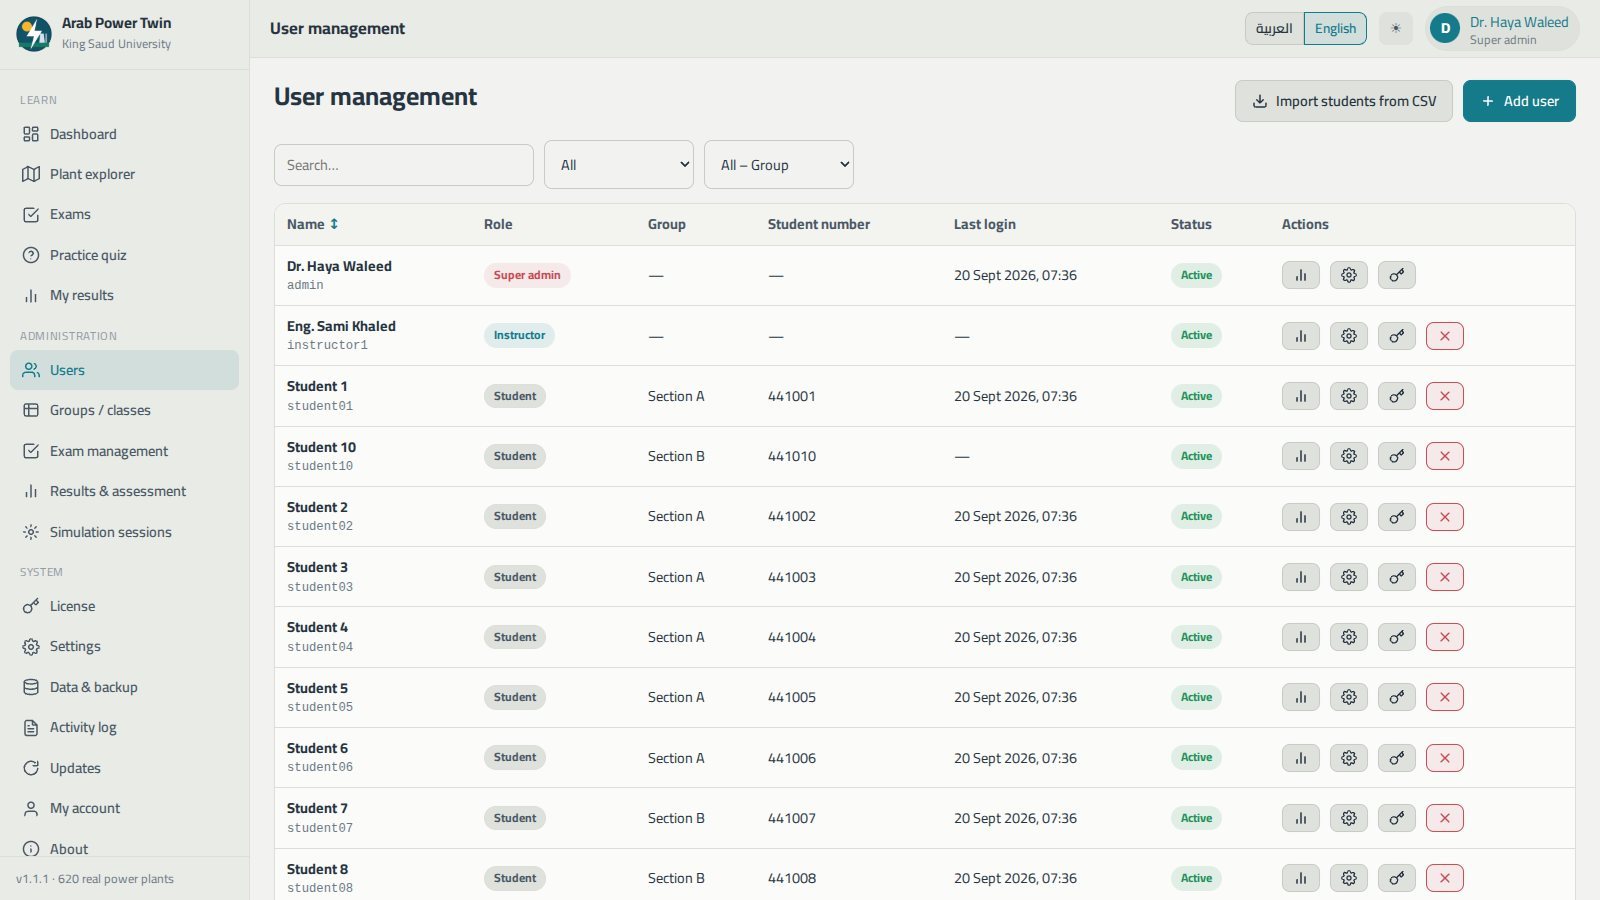
Three roles keep responsibilities clean. The super admin — the department head or course professor — manages everything. Instructors add students, create groups and exams and read all results. Students explore, simulate, take their exams and see only their own results.
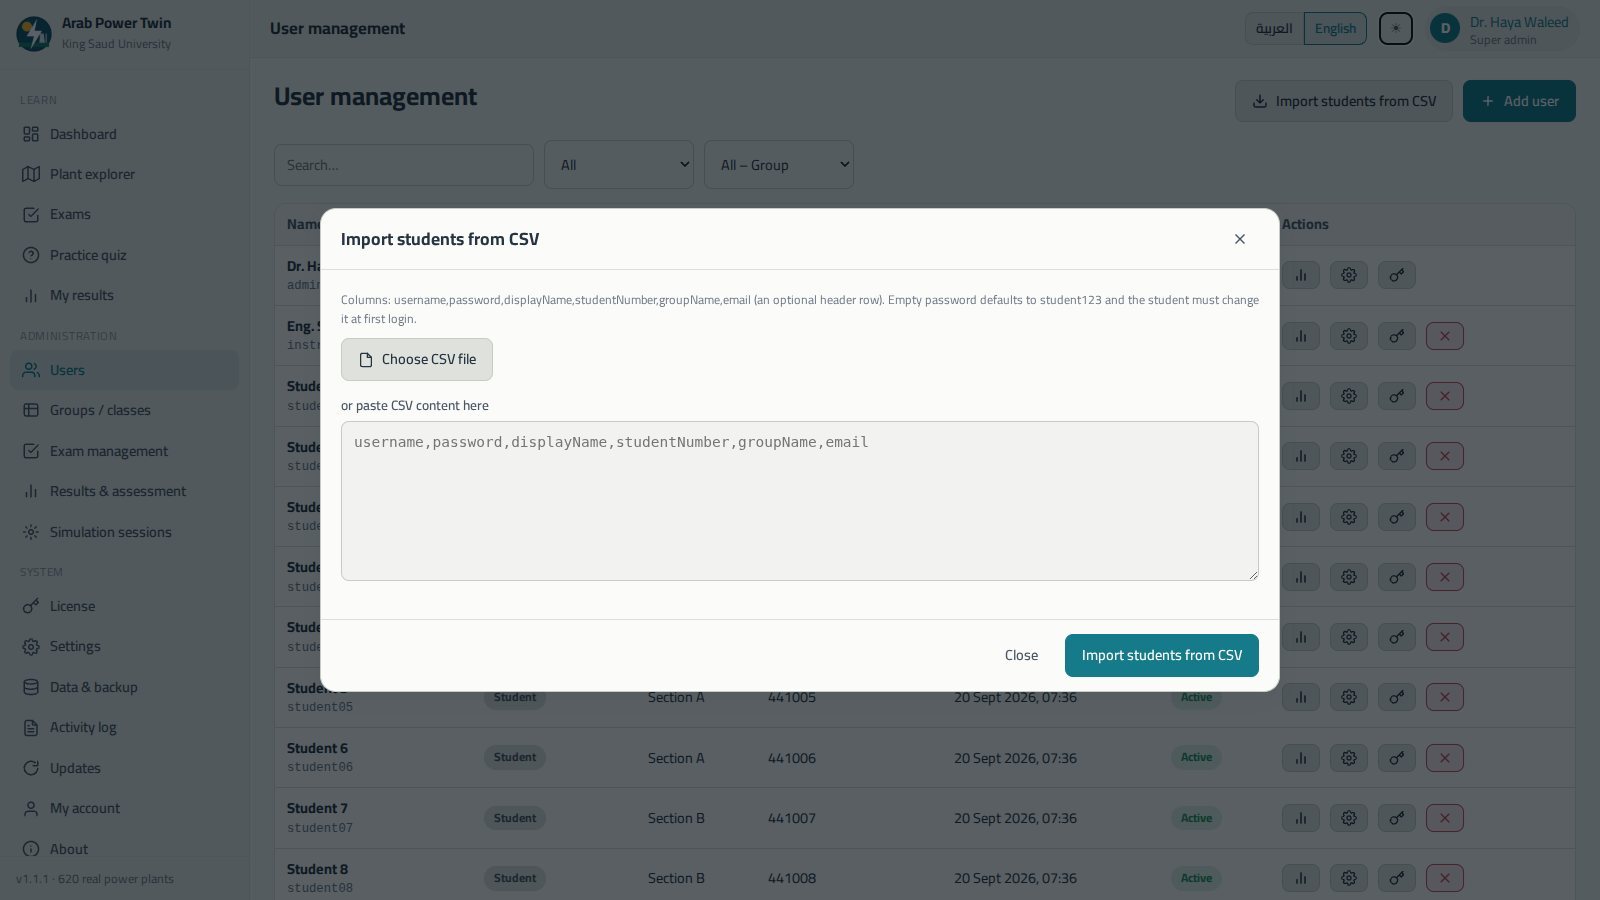
- Import a whole class from a CSV file exported from Excel — missing groups are created automatically, and the import reports what was created and what was skipped, and why.
- Groups and class sections for assigning exams and filtering results.
- Suspend an account instead of deleting it: it can no longer sign in, but its results are kept.
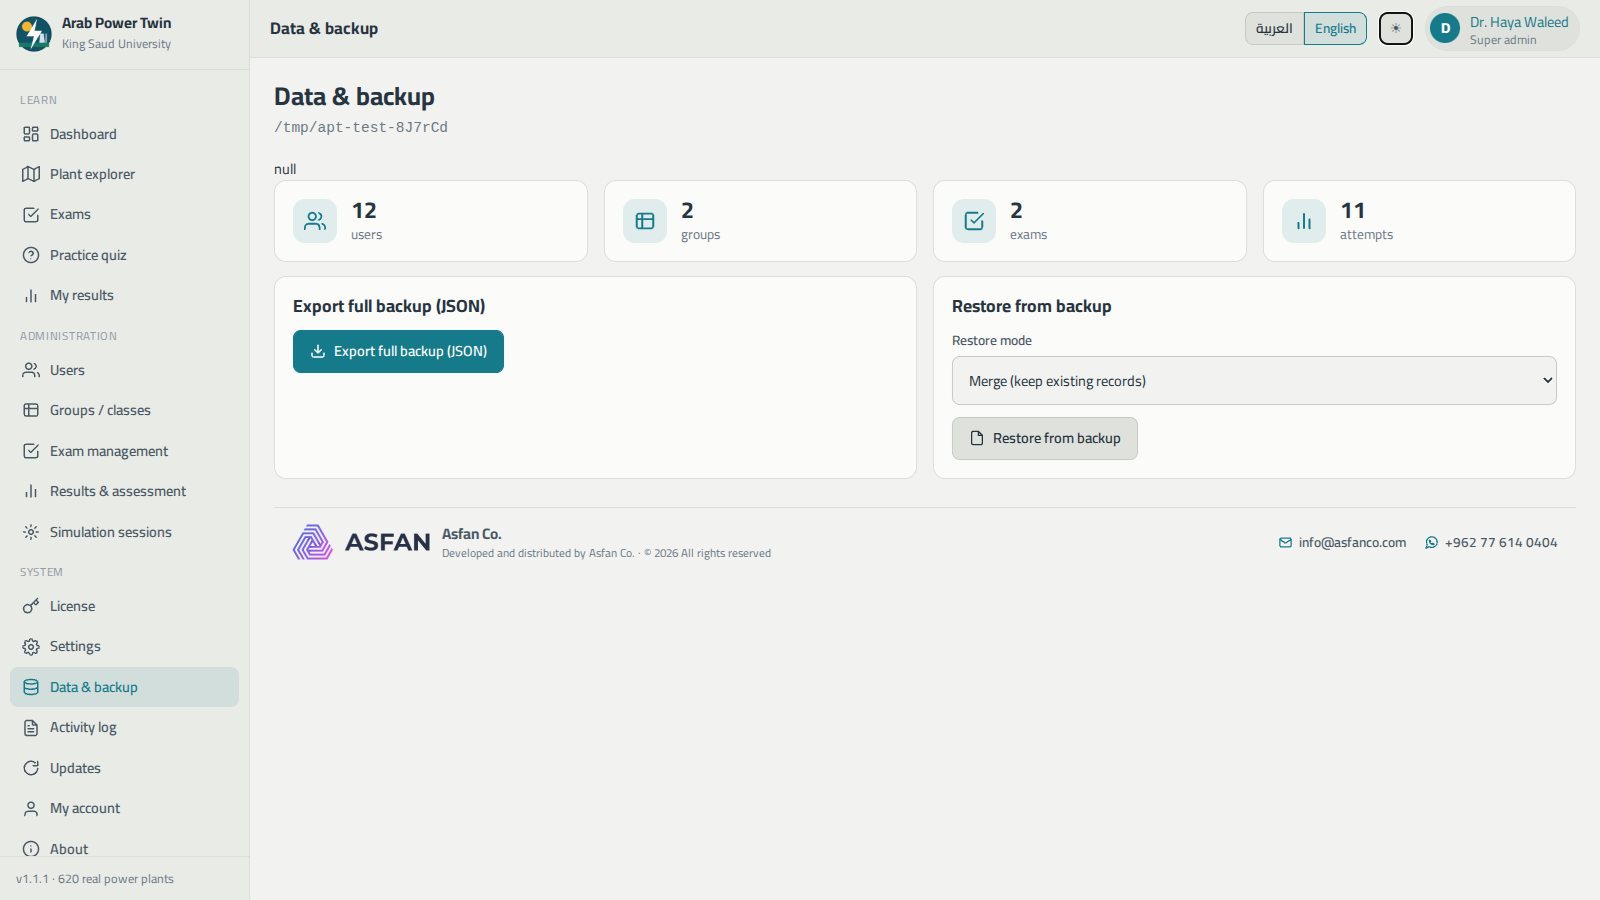
- A full JSON backup and restore, with merge or overwrite, for moving to another computer or a new term.
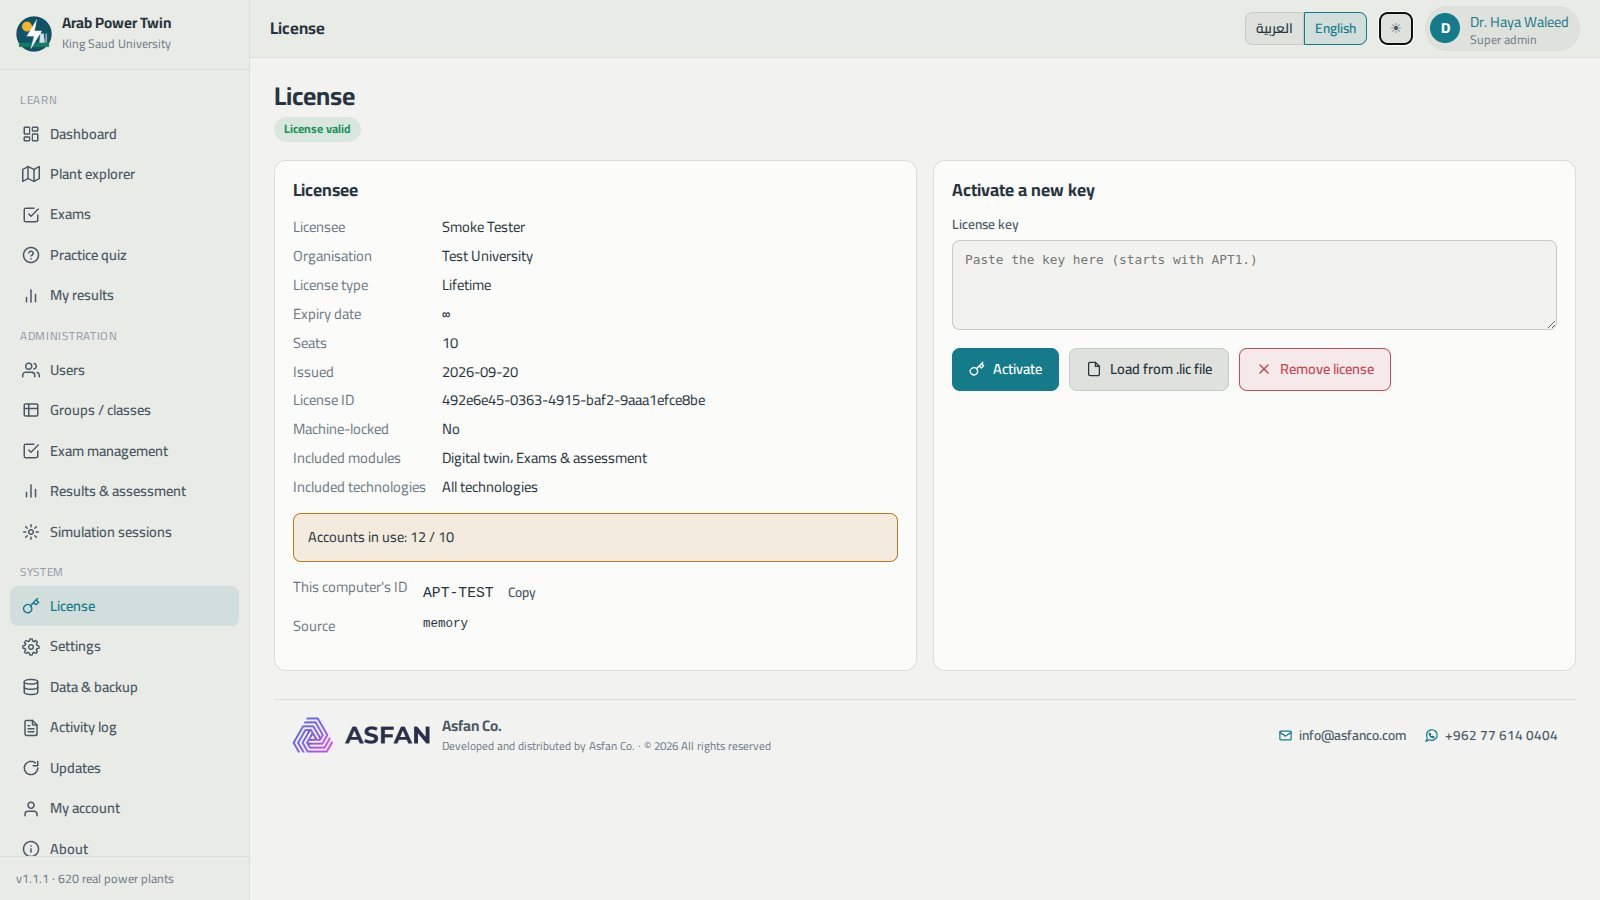
- An activity log of sign-ins, user and exam changes and licence activations.
One shared folder, every lab computer
Install and activate the program on each machine, then point them all at one shared folder on the university server. The instructor sees every student and every result from any computer in the lab — with no database and no server software to run.
- Each record is saved as its own file, so several computers can work at the same time safely.
- License seats are counted per data folder, so a shared account counts once.
- If the shared folder is unreachable the program falls back to the local folder and shows a notice, then picks up again when the network returns.
- Add the students once and they can sign in from any machine.
Sixteen technologies, modelled individually
Each technology has its own physics, its own indicators and its own 3D scene — a combined-cycle plant does not behave, or look, like a hydro dam.
- Combined-cycle gas turbine (CCGT)
- Open-cycle gas turbine (OCGT)
- Oil/gas-fired steam plant
- Coal-fired steam plant
- Diesel / HFO engines
- Solar photovoltaic
- CSP — parabolic trough
- CSP — central tower
- Onshore wind farm
- Hydroelectric dam
- Run-of-river / barrage hydro
- Nuclear — pressurised water reactor
- Biomass
- Waste-to-energy
- IGCC
- Oil-shale steam plant
See it before you install it
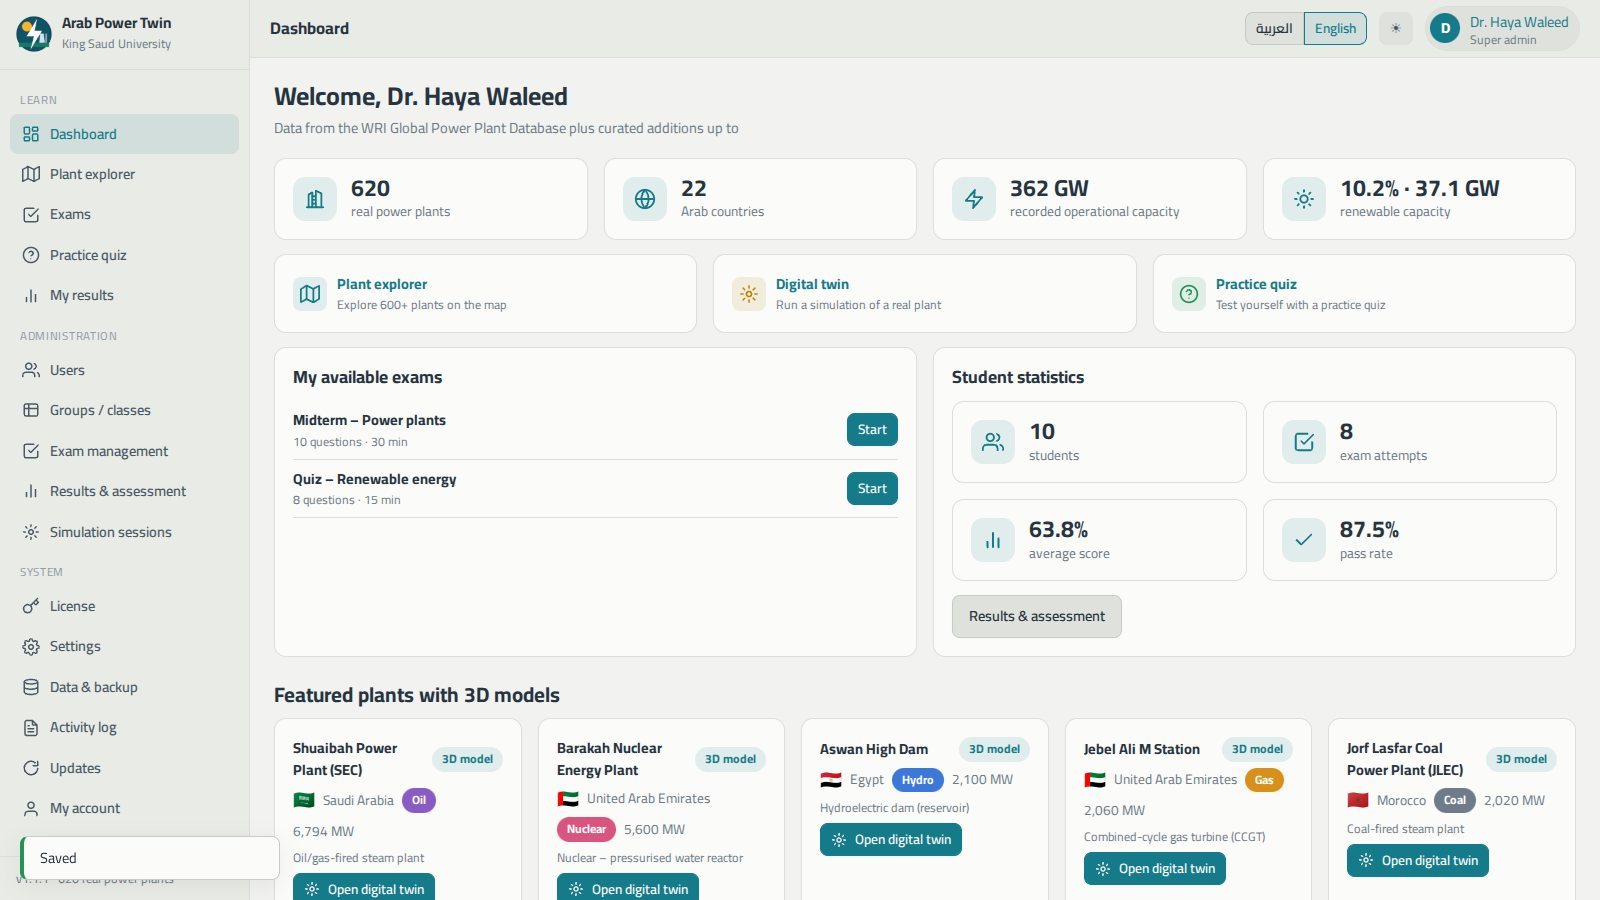
Real screens from version 1.1.1.
From installer to a working class
No administrator password, no database, no server — and nothing you do during the trial is lost when you activate.
Install
Run ArabPowerTwin-Setup.exe, choose Arabic or English and keep the default folder. It installs for the current Windows user only.
Activate
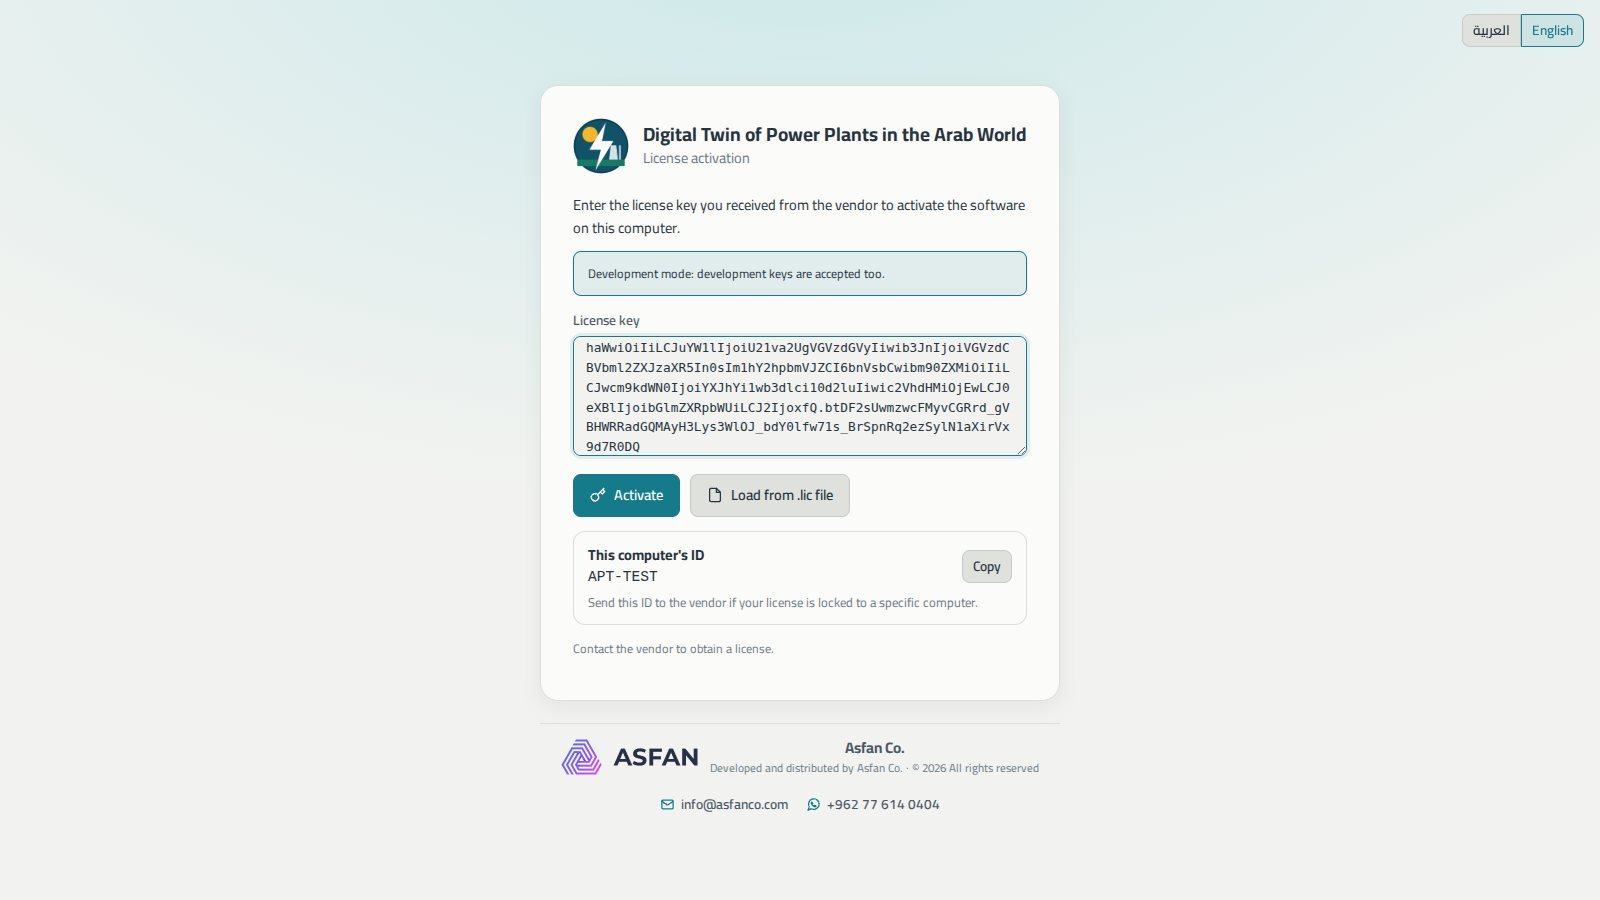
Paste the key we send you — it starts with APT1. — or load the .lic file. It is verified on the computer itself, with no internet needed.
Create the super admin
Enter your institution's name and create the account that will manage users, groups, exams and the license.
Add your students
Add them one by one, or import a whole section from a CSV file — then assign your first exam.
What the 14-day trial gives you
The trial starts on first install and needs no key, no payment details and no account.
- A selection of the program's modules, enough to evaluate it for your faculty
- Both interface languages
- The remaining modules and technologies unlock when a license key is entered
Monthly or Annual — your choice
A license sets the number of seats, which modules are included — digital twin and/or exams — and which technologies are covered.
Not sure yet? Install the 14-day trial first — no key, no payment, no account.
Download TrialMonthly
Time-limited access, renewed every month.
Contact us
for current pricing
- Both modules: digital twin and exams & assessment
- Your chosen number of seats across all roles
- Your chosen technologies, or all sixteen
- Free updates while the subscription is active
- Ideal for a single semester or a pilot
Annual
Full access for 12 months, renewed every year.
Contact us
for current pricing
- Everything in the Monthly license
- One payment covers a full year
- Free automatic updates
- Seats counted per shared data folder — perfect for a lab
- Ideal for a full academic year
Equipping a university lab? Tell us how many machines and students you need — contact us or message us on WhatsApp at +962 77 614 0404.
Before you install
- Operating system
- Windows 10 or 11, 64-bit
- Processor & memory
- Dual-core or better, 8 GB RAM (16 GB recommended for labs)
- Graphics
- Any adapter with WebGL 2. The 3D scene is smoother on a discrete GPU
- Disk space
- About 700 MB for the program and its data
- Screen
- 1366 × 768 minimum · 1920 × 1080 recommended
- Internet
- Not required to run — used only to check for and download updates
- Administrator rights
- Not needed — installs for the current user
- Current version
- 1.1.1, with automatic updates
Full user manual
48 pages covering every screen, licensing and setting up a university lab.
Common questions
More energy education software
Teach power generation with Arab plants
Install the 14-day trial today, or talk to our team about a Monthly or Annual subscription sized for your faculty or lab.