
On This Page
Most green hydrogen that crosses an ocean will travel as ammonia. That makes green ammonia the point where renewable electricity, electrolysis and a century-old chemical process meet, and the hardest part to teach, because the synthesis loop wants a steady feed while the sun and wind do not provide one. Digital twin green ammonia simulation software shows that tension live.
The ASFAN Renewable Energy Digital Twin models the NEOM Green Hydrogen Project in Saudi Arabia all the way to its product: 1.2 million tonnes of green ammonia a year, made from hydrogen and nitrogen and shipped from an export jetty at the Oxagon port. Students can follow a kilogram of hydrogen from the electrolyser hall to the ammonia tanks. This guide is written for universities, technical colleges and training centres in Saudi Arabia. NEOM is in Saudi Arabia, so students in the Kingdom study a project in their own country.
Download the software, brochure and user manual
The Renewable Energy Digital Twin runs on Windows 10 and 11. The trial needs no key, no payment details and no account.
The user manual is also available in Arabic.
What the green ammonia digital twin simulates
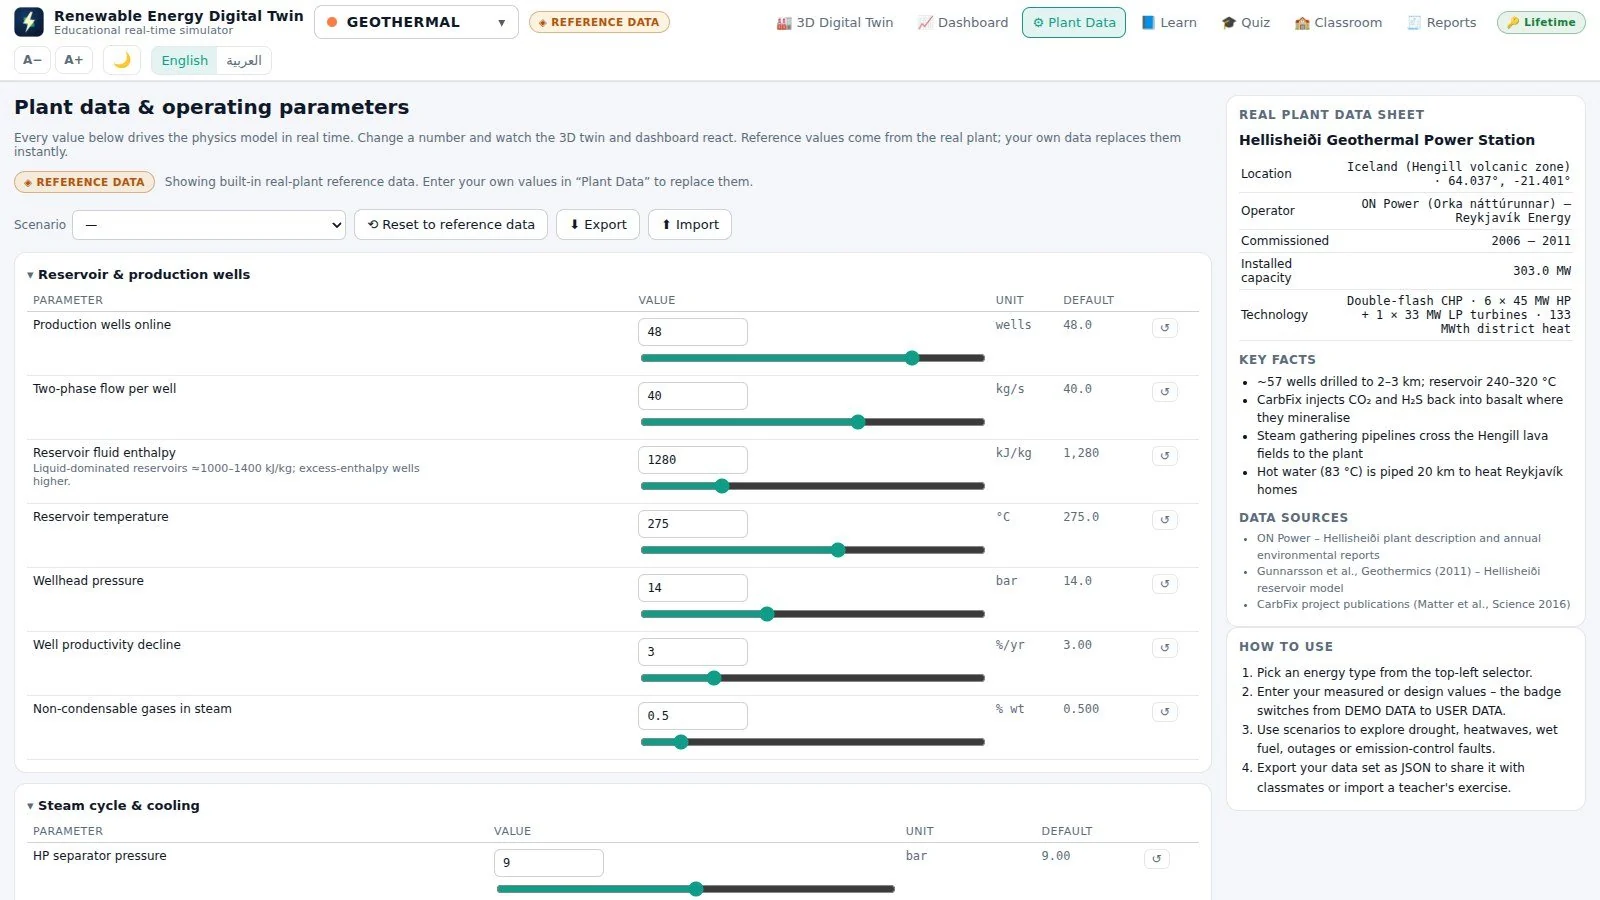
The reference plant is the NEOM Green Hydrogen Project (ammonia plant, Oxagon port) in Saudi Arabia. Its figures come from the operator’s published data and are shown on the plant data sheet inside the program.
| Operator | NEOM Green Hydrogen Company (ACWA Power, Air Products, NEOM) |
|---|---|
| Commissioning | 2026 – 2027 (design data) |
| Product | 1.2 Mt green ammonia per year from 600 t H₂ per day |
| Ammonia chain | H₂ compression and buffer storage, air separation unit, Haber-Bosch synthesis, ammonia tanks and export jetty |
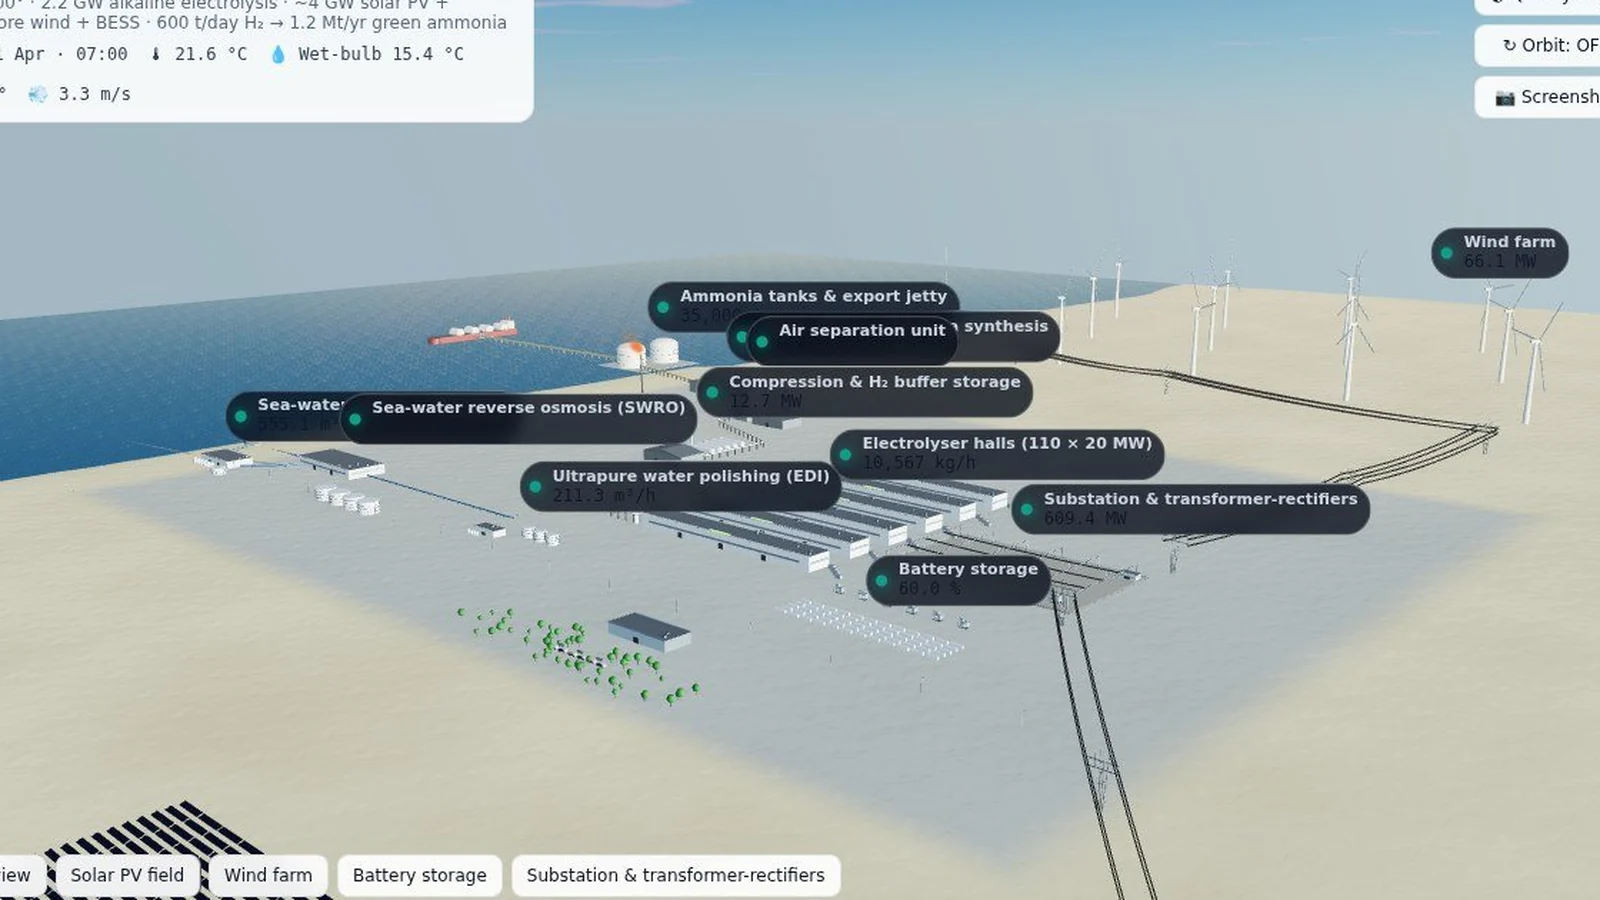
Hydrogen from 2.2 GW of alkaline electrolysers is compressed into buffer storage. An air separation unit supplies the nitrogen, and the Haber-Bosch synthesis combines the two (N₂ + 3 H₂ → 2 NH₃). Because the whole site runs off-grid on solar, wind and batteries, the buffer is what keeps the ammonia synthesis fed when the weather changes. The twin shows ammonia production as a live value next to hydrogen output, buffer level and battery state of charge.
Live values on the dashboard
The dashboard shows gauges with limit marks, trend charts over one hour, 24 hours or 31 days, a Sankey energy-flow diagram and the live alarm list. For this plant the main gauges are:
- Ammonia production
- Hydrogen production
- Buffer storage level
- Renewable power available
- Battery state of charge
- Electrolysis power
- Specific energy consumption
- Levelised cost of hydrogen
Scenarios to run in class
Each scenario changes the plant with one click, and every value downstream follows. Run one, let the class predict what will happen, then compare with the twin:
- Design operation: steady hydrogen supply and full ammonia output.
- Dust storm (40 % solar, weak wind): hydrogen output drops, the buffer drains and students see how long ammonia synthesis can hold.
- Large H₂ buffer + 1 GWh battery: more storage between the electrolysers and the synthesis, and a steadier ammonia output.
- Grid-connected (500 MW import): a firm power supply and what it does to ammonia production.
- 2030 costs: how cheaper equipment changes the cost of the hydrogen that goes into the ammonia.
Plant components you can inspect
Click a label in the 3D view, or a component in the side list, to see its live values and a short description:
- Electrolyser halls
- Compression & H₂ buffer storage
- Air separation unit
- Haber-Bosch ammonia synthesis
- Ammonia tanks & export jetty
- Solar PV field
- Wind farm
- Battery storage
What students learn
Each technology comes with its own Learn pages (overview, the process step by step, the key equations, the real plant data sheet, environment and a glossary) and its own quiz bank. Typical learning outcomes:
- Write the ammonia mass balance: hydrogen is about 17.8 % of ammonia by mass, so 1.2 Mt of NH₃ a year needs roughly 213,000 t of H₂, about 585 t a day, consistent with NEOM's 600 t/day design.
- Explain why ammonia is used to carry hydrogen for export.
- Size hydrogen buffer storage against the variability of solar and wind supply.
- Trace the cost of green ammonia back to electricity, electrolysis and storage.
Quizzes run in practice or timed exam mode, include questions on live data, and print certificates. With a supervisor licence, results from the whole class are collected in a shared folder, with no server needed. For hands-on equipment practice, pair the twin with ASFAN’s VR green hydrogen training.
Build your own green ammonia plant
Planning a power-to-ammonia project? Build your own green hydrogen plant in the program, entering electrolyser capacity, solar and wind supply and storage, and study how much hydrogen is available for ammonia synthesis.
This twin is one of seven in the same program. See the overview of digital twin renewable energy simulation software for the other six plants.
Trial, licences and system requirements
The 14-day trial opens all seven 3D digital twins with live values, camera presets and day/night lighting, every Learn page, both interface languages and simulation speeds up to 10×. A licence unlocks the dashboard, Plant Data and scenarios, the quiz and certificates, reports and data export, the faster simulation speeds, the plant builder and Classroom mode. Licences are monthly or annual and can cover all seven technologies or only the ones you teach; supervisor licences add the Classroom results table.
- Operating system: Windows 10 or 11, 64-bit
- Memory: 4 GB minimum, 8 GB or more recommended
- Graphics: any chip with WebGL 2 (Intel HD 500 series or newer)
- Disk: 600 MB minimum, 1 GB recommended
- Internet: not required; used only for automatic updates and satellite imagery
- User rights: standard user, no administrator password
FAQ: Digital Twin Green Ammonia Simulation Software
What is digital twin green ammonia simulation software?
It is software that models green ammonia production as part of a live 3D plant: renewable power feeds electrolysers, hydrogen is buffered, nitrogen comes from an air separation unit, and Haber-Bosch synthesis produces ammonia. The ASFAN Renewable Energy Digital Twin does this for NEOM.
How much green ammonia does the NEOM twin produce?
The reference design is 1.2 million tonnes of green ammonia a year from 600 t of hydrogen a day. Ammonia production is shown as a live gauge.
Does the software model the Haber-Bosch process?
The Haber-Bosch synthesis, the air separation unit and the ammonia tanks and export jetty are part of the plant model and can be inspected in the 3D twin. It is an educational model, not a detailed reactor design tool.
Why does renewable variability matter for green ammonia?
Ammonia synthesis prefers a steady feed, while solar and wind vary. The dust storm and storage scenarios show how hydrogen buffer and batteries decide how steadily the ammonia plant can run.
Can I see the ammonia plant in the free trial?
Yes. The 14-day trial opens the NEOM twin, including the ammonia section, with live values and every Learn page.
Client & Visitor Reviews
Share your experience, feedback, or opinion about this page content.
Write a Review
Latest Reviews