
On This Page
A geothermal plant is hard to teach from a textbook. The resource is underground, the steam is two-phase, and the interesting behaviour, such as a reservoir that slowly declines or silica that starts to scale the pipes, takes years to show up on a real site. Digital twin geothermal simulation software compresses those years into a lesson.
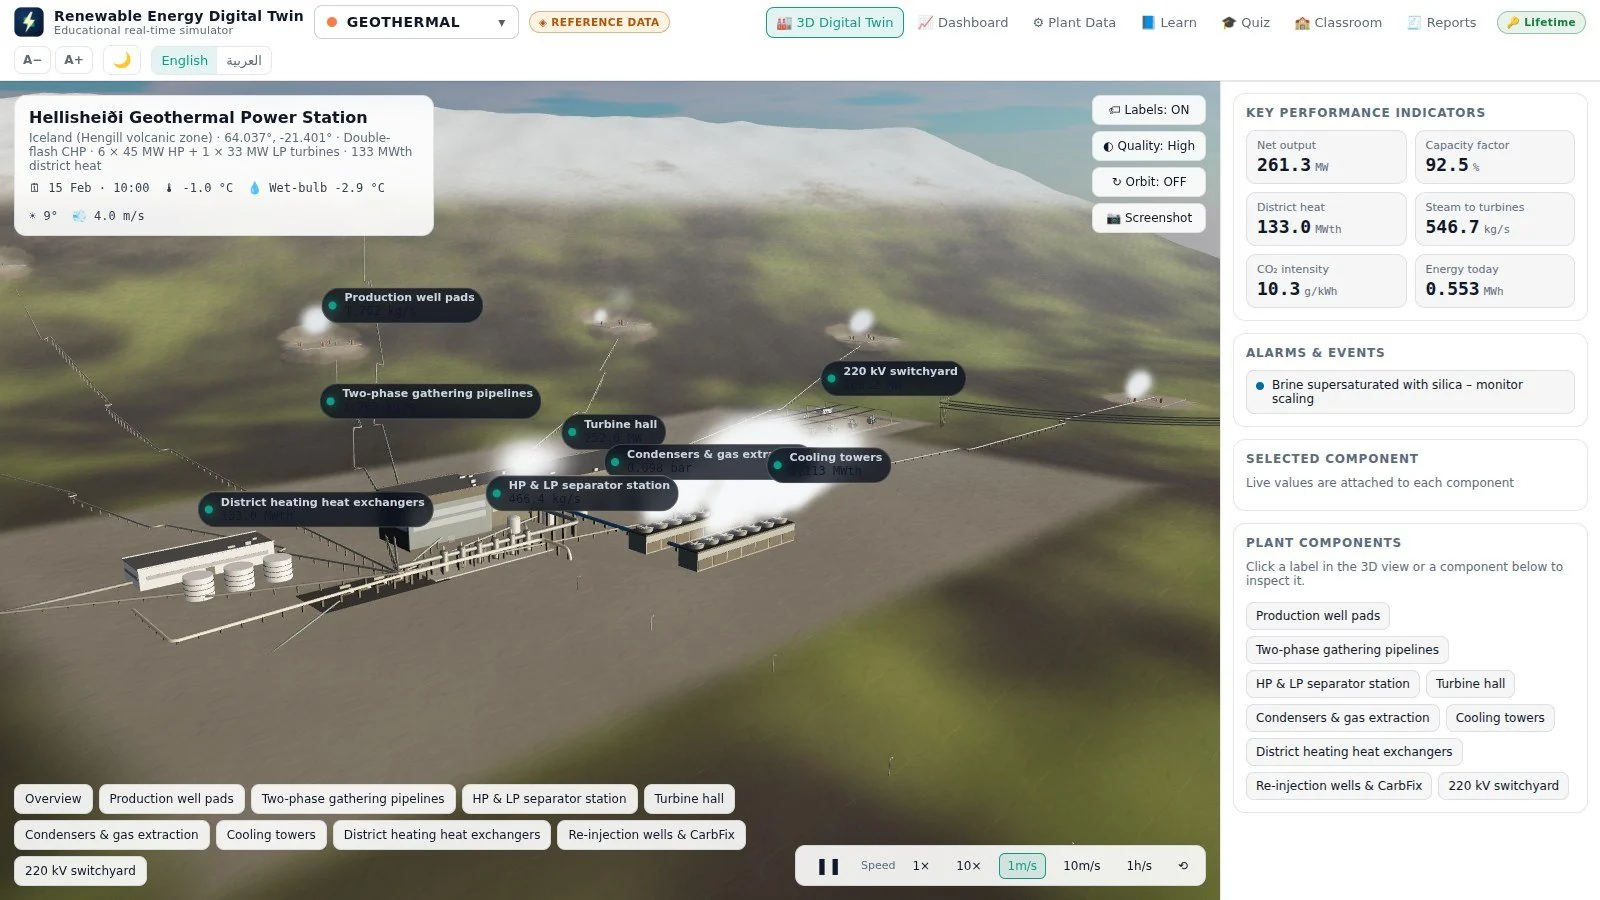
The ASFAN Renewable Energy Digital Twin rebuilds the Hellisheiði Geothermal Power Station in Iceland, one of the largest geothermal combined heat and power plants in the world, as a running 3D model. Every label on the plant and every value on the dashboard is computed live from a physics model, so when a student changes the wellhead enthalpy or the number of producing wells, the whole plant answers. This guide is written for universities, technical colleges and training centres in the UAE.
Download the software, brochure and user manual
The Renewable Energy Digital Twin runs on Windows 10 and 11. The trial needs no key, no payment details and no account.
The user manual is also available in Arabic.
What the geothermal digital twin simulates
The reference plant is the Hellisheiði Geothermal Power Station in Iceland. Its figures come from the operator’s published data and are shown on the plant data sheet inside the program.
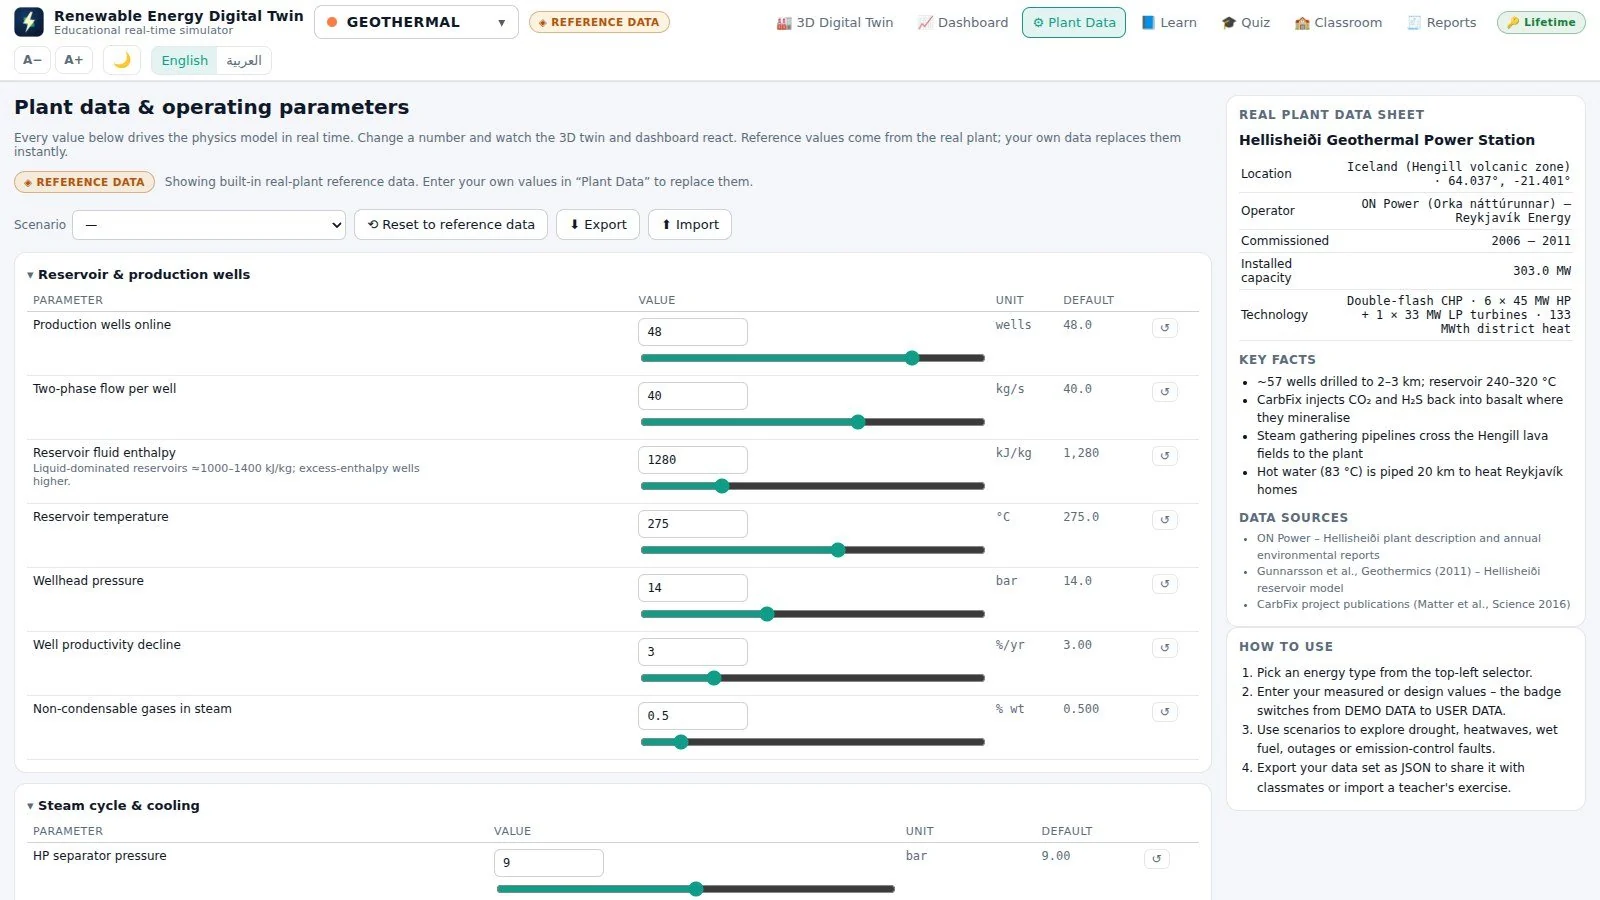
| Operator | ON Power (Orka náttúrunnar), Reykjavík Energy |
|---|---|
| Commissioned | 2006 – 2011 |
| Capacity | 303 MW electricity + 133 MWth district heat |
| Technology | Double-flash combined heat and power: 6 × 45 MW high-pressure and 1 × 33 MW low-pressure turbines |
About 57 wells drilled 2 to 3 km deep tap a reservoir at 240 to 320 °C. The two-phase flow is separated into high-pressure and low-pressure steam that drives the turbines. The separated brine and the condensate are re-injected, and the CarbFix process injects CO₂ and H₂S into the basalt, where they mineralise. Hot water at 83 °C is piped 20 km to heat Reykjavík. The twin follows each of these steps with its own equations.
Live values on the dashboard
The dashboard shows gauges with limit marks, trend charts over one hour, 24 hours or 31 days, a Sankey energy-flow diagram and the live alarm list. For this plant the main gauges are:
- Net electrical output
- District heat delivered
- High-pressure steam flow
- Wellhead pressure
- Condenser pressure
- CO₂ intensity
- Silica saturation index
- Electrical efficiency
Scenarios to run in class
Each scenario changes the plant with one click, and every value downstream follows. Run one, let the class predict what will happen, then compare with the twin:
- Design operation: the reference point every other case is compared against.
- Winter, maximum heat demand: more hot water goes to Reykjavík; watch how the split between power and heat moves.
- Aging reservoir (25 wells, high decline): the resource weakens, output falls and students have to explain why.
- High-enthalpy wells (2,000 kJ/kg): hotter, drier fluid; a good way to show why enthalpy, not temperature alone, sets output.
- CarbFix offline: non-condensable gases are no longer re-injected and the CO₂ intensity gauge responds.
Plant components you can inspect
Click a label in the 3D view, or a component in the side list, to see its live values and a short description:
- Production well pads
- Two-phase gathering pipelines
- HP & LP separator station
- Turbine hall
- Condensers & gas extraction
- Cooling towers
- District heating heat exchangers
- Re-injection wells & CarbFix
- 220 kV switchyard
What students learn
Each technology comes with its own Learn pages (overview, the process step by step, the key equations, the real plant data sheet, environment and a glossary) and its own quiz bank. Typical learning outcomes:
- Explain flash separation and why a double-flash plant extracts more power than a single-flash one.
- Read the silica saturation index and connect it to scaling risk in the re-injection line.
- Compare electricity and district heat as products of the same resource, and see the Sankey diagram split between them.
- Quantify how reservoir decline shows up as falling wellhead pressure and output.
Quizzes run in practice or timed exam mode, include questions on live data, and print certificates. With a supervisor licence, results from the whole class are collected in a shared folder, with no server needed. For hands-on equipment practice, pair the twin with ASFAN’s VR geothermal training.
Build your own geothermal plant
Planning a geothermal project of your own? Enter the reservoir temperature, the number of wells, the flow per well and the turbine configuration, and the program builds a 3D twin of your design and runs the same geothermal physics on your numbers.
This twin is one of seven in the same program. See the overview of digital twin renewable energy simulation software for the other six plants.
Trial, licences and system requirements
The 14-day trial opens all seven 3D digital twins with live values, camera presets and day/night lighting, every Learn page, both interface languages and simulation speeds up to 10×. A licence unlocks the dashboard, Plant Data and scenarios, the quiz and certificates, reports and data export, the faster simulation speeds, the plant builder and Classroom mode. Licences are monthly or annual and can cover all seven technologies or only the ones you teach; supervisor licences add the Classroom results table.
- Operating system: Windows 10 or 11, 64-bit
- Memory: 4 GB minimum, 8 GB or more recommended
- Graphics: any chip with WebGL 2 (Intel HD 500 series or newer)
- Disk: 600 MB minimum, 1 GB recommended
- Internet: not required; used only for automatic updates and satellite imagery
- User rights: standard user, no administrator password
FAQ: Digital Twin Geothermal Simulation Software
What is digital twin geothermal simulation software?
It is a program that rebuilds a geothermal power plant as a 3D model driven by a physics simulation, so the displayed values (steam flow, pressure, output, heat delivered) are calculated rather than animated. The ASFAN Renewable Energy Digital Twin does this for the Hellisheiði plant in Iceland.
Which geothermal plant does the software model?
Hellisheiði Geothermal Power Station, a 303 MW double-flash combined heat and power plant that also supplies 133 MWth of district heat to Reykjavík.
Can students change the geothermal parameters?
Yes. With a licence, the Plant Data page exposes every operating parameter of the model with its reference value alongside, and one-click scenarios such as an aging reservoir or CarbFix going offline.
Are the values real measurements from Hellisheiði?
No. They are estimates from a physics model built on the plant's published design data. The program is an educational simulator and must not be used for operational or commercial decisions.
Can I try the geothermal twin before buying?
Yes. The 14-day trial opens all seven 3D twins, including Hellisheiði, with live values and every Learn page. No key, payment or account is needed.
Client & Visitor Reviews
Share your experience, feedback, or opinion about this page content.
Write a Review
Latest Reviews