Available now for Windows 10 / 11

Renewable Energy Digital Twin

A real-time 3D simulator of renewable power plants. Seven real sites — geothermal, biomass, waste-to-energy, hydropower, green hydrogen, wind and solar — each rebuilt as a digital twin whose every label, gauge and chart is computed live from a physics model. Change a parameter and watch the whole plant respond.

14-day free trial English & Arabic (RTL) No server, no internet needed Version 1.4.0
Renewable Energy Digital Twin — 3D Digital Twin
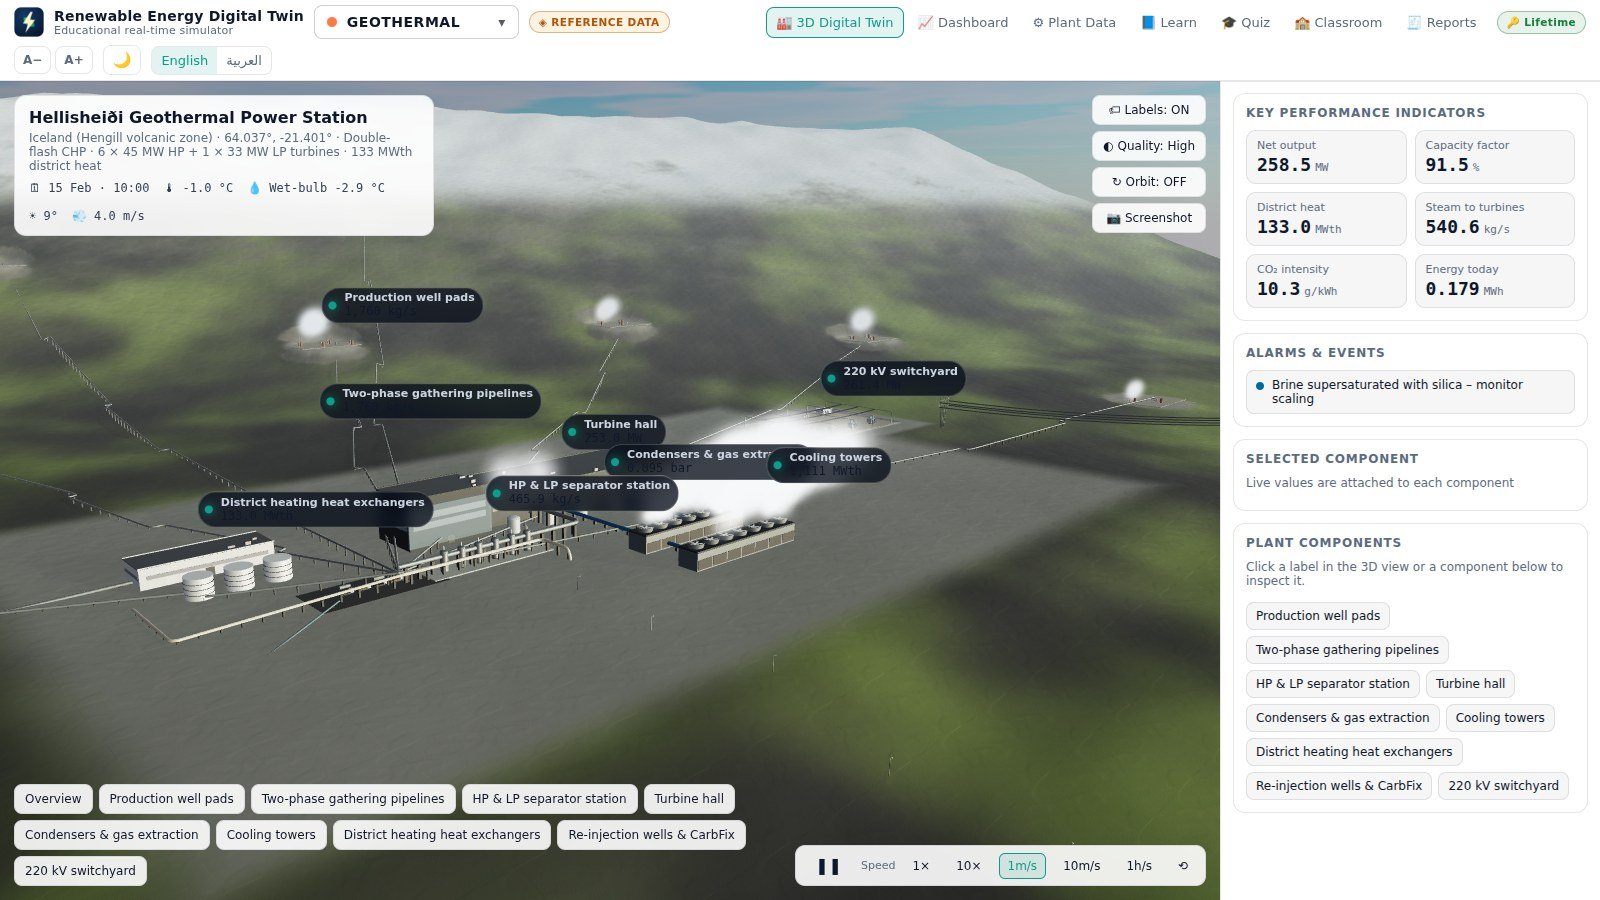
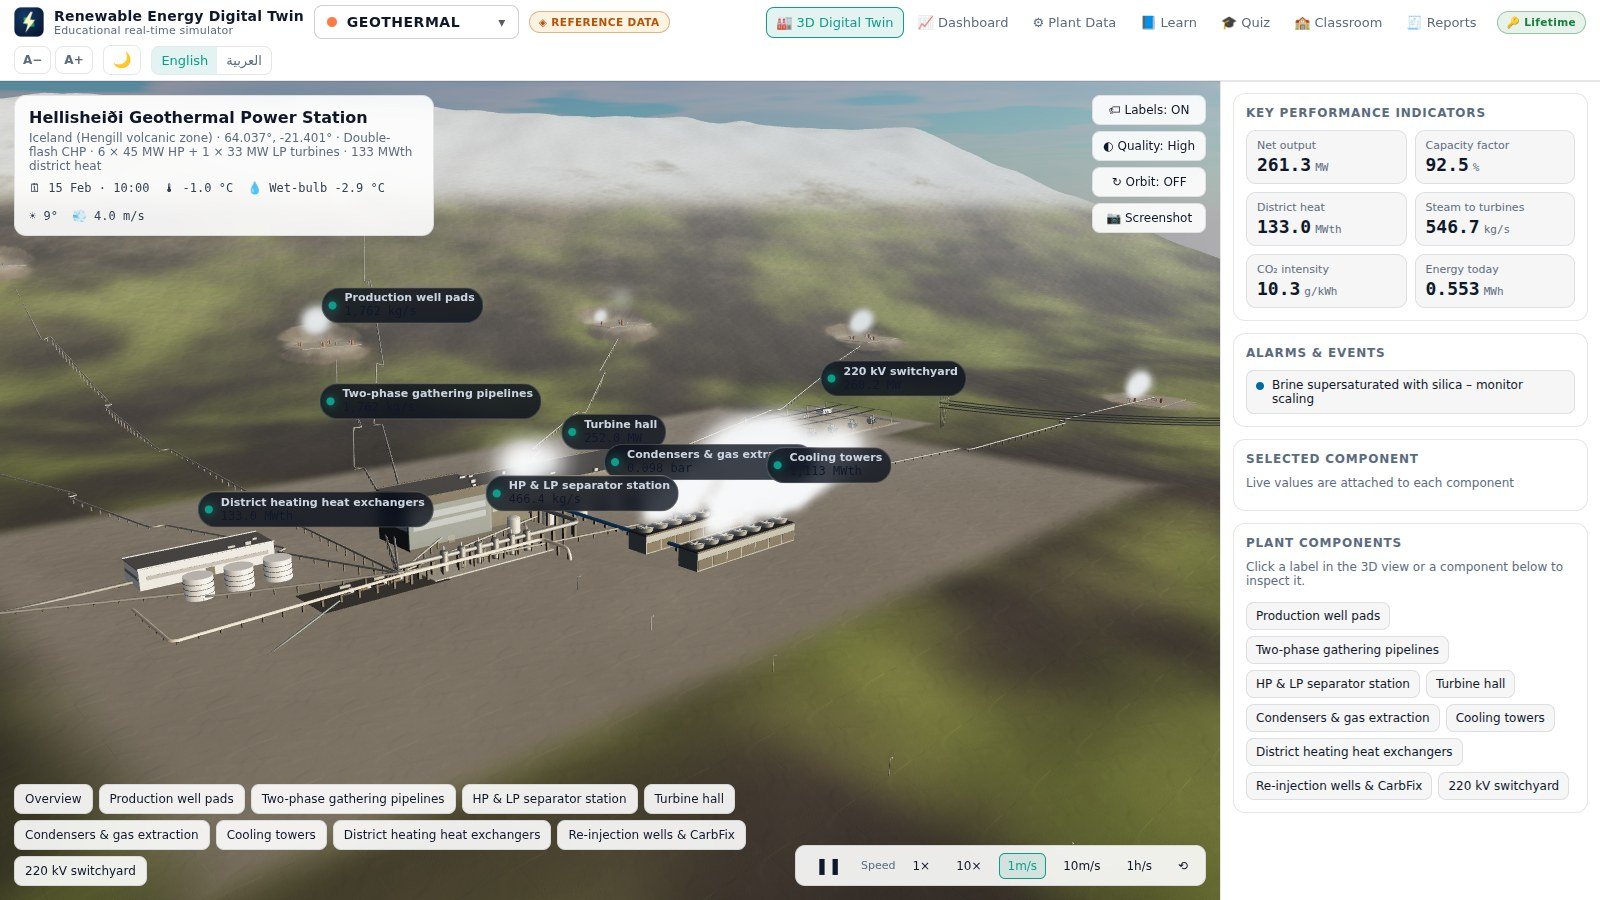
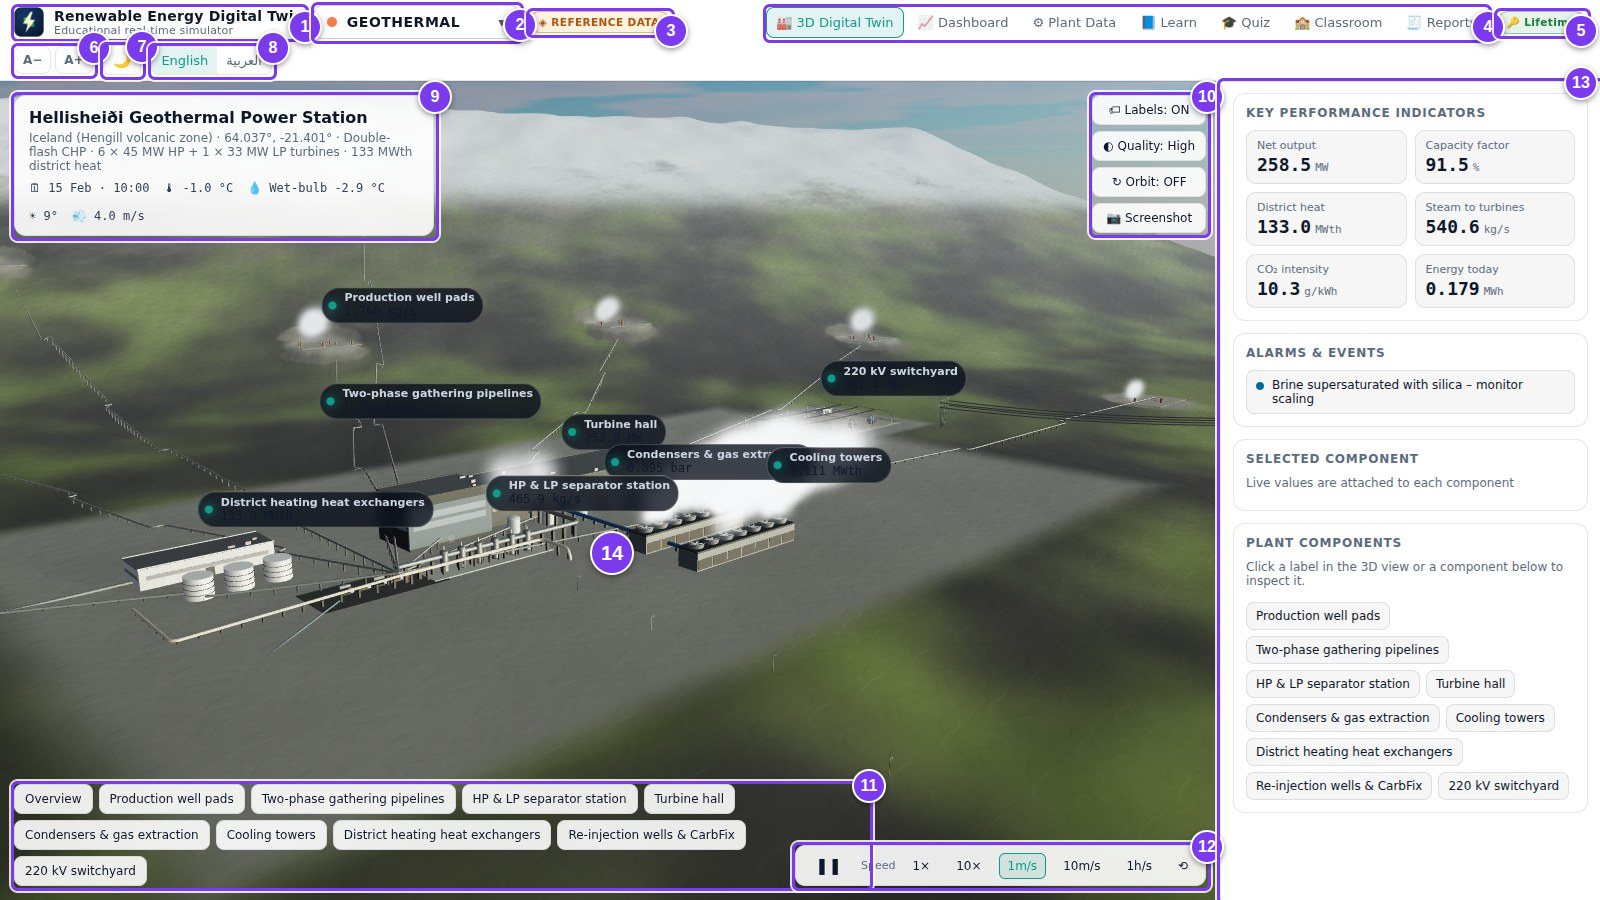
The 3D digital twin of the Hellisheidi geothermal power station in Renewable Energy Digital Twin, with live value labels on every component and key performance indicators in the sidebar
Hellisheiði, Iceland — 258.5 MW net, 91.5 % capacity factor and 133 MWth of district heat, all computed live.
7real reference plants
25–50live process values per plant
1800×simulation speed, up to 1 h/s
plants you can design yourself
2interface languages
What is inside

A control room, a classroom and a design office in one program

Seven pages, each doing one job well — and all of them driven by the same running physics model.

3D Digital Twin

The plant on its real terrain, with satellite imagery, day and night lighting, moving steam, trucks, trains and turbines — every component labelled with its live value.

Dashboard

Gauges with limit marks, trend charts over 1 hour, 24 hours or 31 days, a Sankey energy-flow diagram, every process value and the live alarm list.

Plant Data

Every operating parameter of the physics model, editable, with its real reference value alongside — plus one-click scenarios like drought, heatwave or storm.

Learn

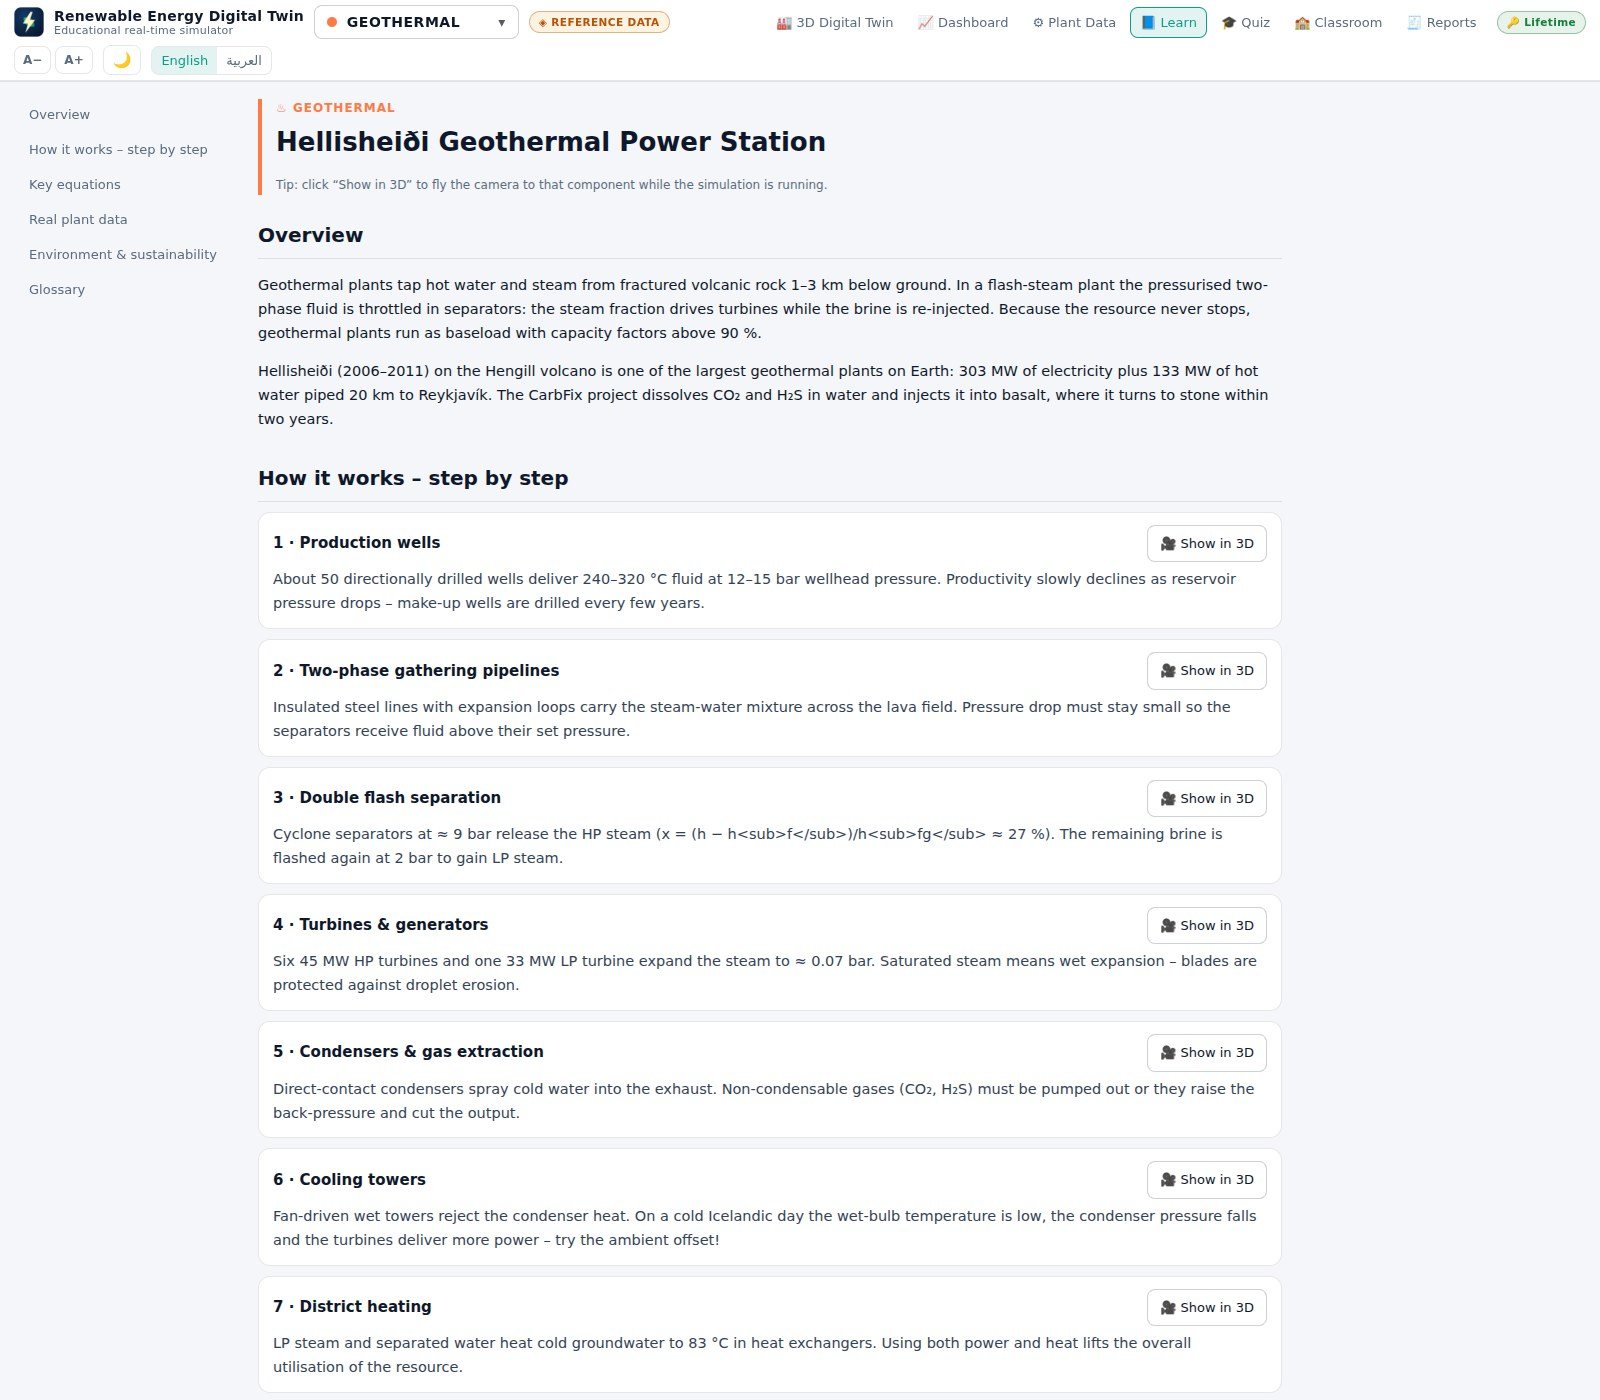
A compact course per technology: overview, the process step by step, the key equations, the real plant data sheet, environment and a glossary.

Quiz & Classroom

Auto-graded practice and timed exam modes, live-data questions, printable certificates — and a class folder the supervisor reads without a server.

Build your own plant

Enter the design data of a plant you are planning and the program builds its 3D twin and runs the physics on your numbers.

A closer look

Every screen, explained

The 3D twin

Fly around a working power plant

Drag to orbit, scroll to zoom, right-drag to pan — or click a component in the sidebar and the camera flies to it. Every label carries the value that component is producing at this second, and the scene follows the simulation clock, so you see sunrise, sunset and night over the real site.

  • Camera presets for each part of the plant, plus a slow auto-orbit for presentations.
  • Labels on or off, three quality levels, and a one-click PNG screenshot.
  • Real satellite imagery of the site when the computer is online; generated terrain when it is not.
  • A sidebar with the six headline KPIs, the alarm list, and a description of whatever you selected.
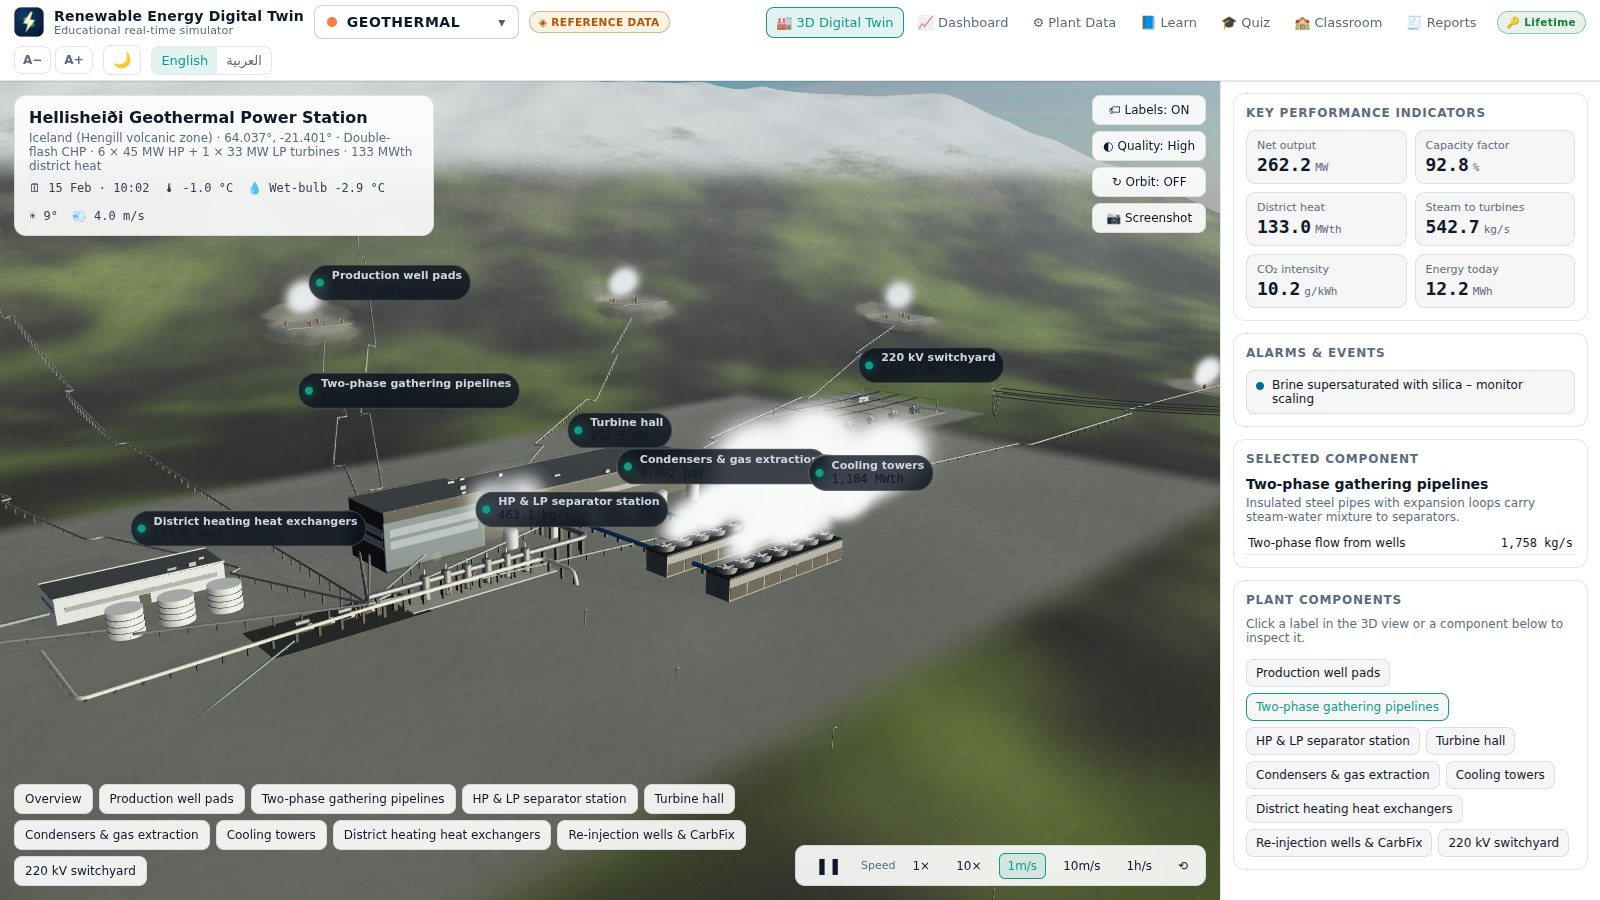
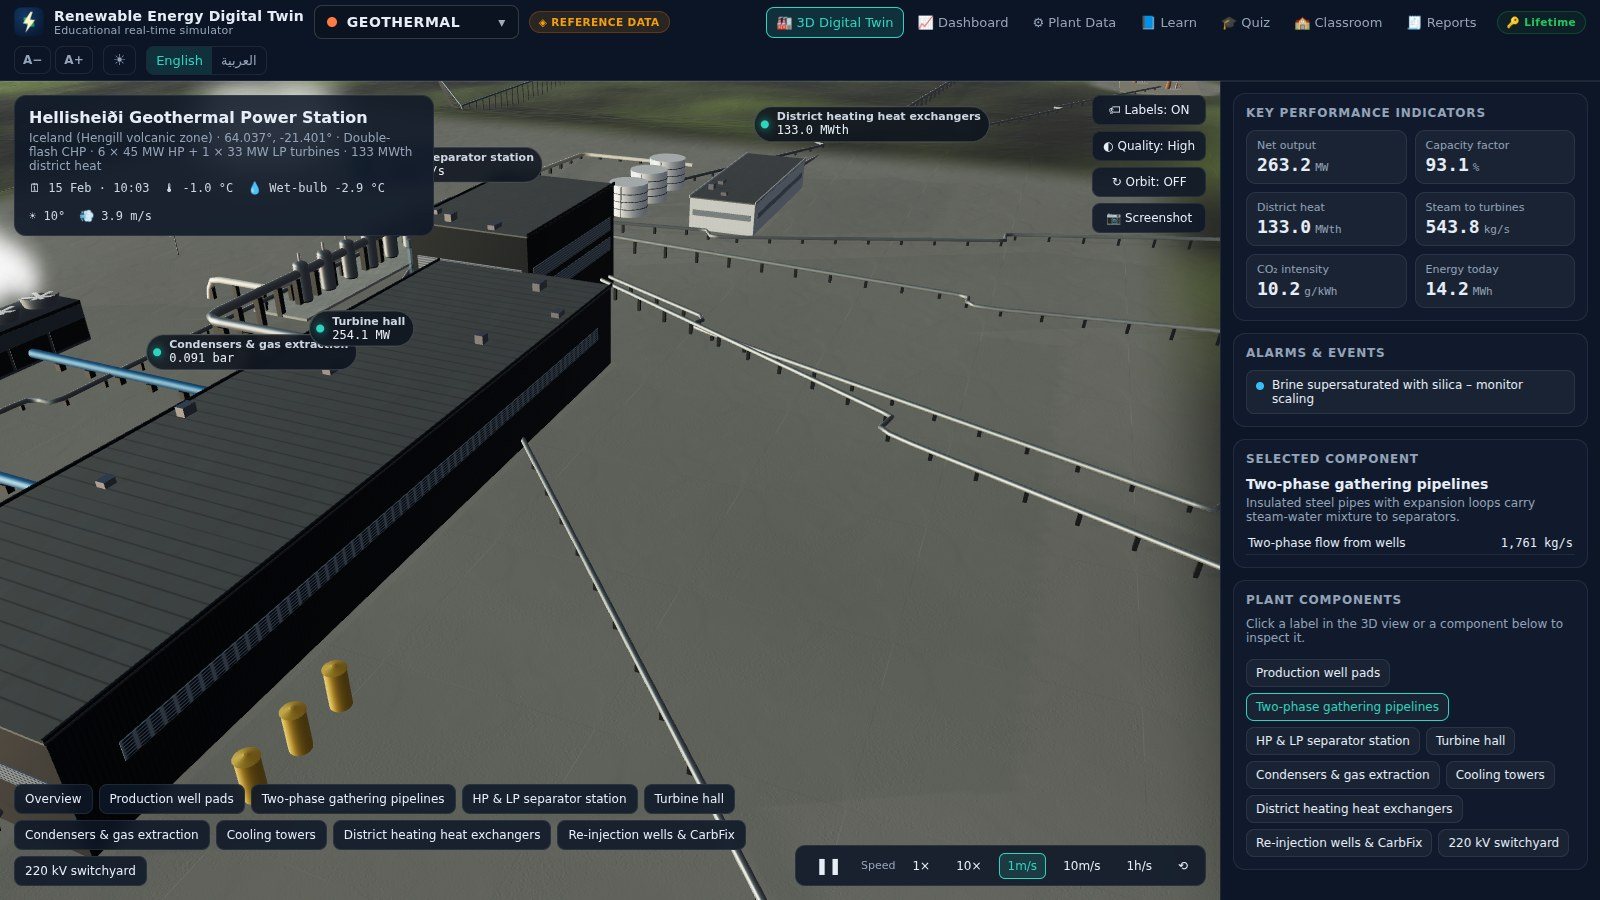
A selected component in the 3D digital twin: the camera has flown to it and the sidebar shows its description and live values
Select a component and the camera flies to it, with its live values in the sidebar.
Dashboard

The plant the way a control room sees it

Up to ten gauges chosen for the technology — net output, fuel feed rate, boiler efficiency, condenser pressure, storage level, emission concentrations — each with its limit marked in red. The page refreshes about once a second.

  • Trend charts with up to four series at once, over 1 h, 24 h or 31 simulated days.
  • A Sankey diagram showing exactly where the energy goes — and where it is lost.
  • The complete list of computed values, each with a bar showing where it sits in its normal range.
  • Alarms in three levels, plus the last events: a unit tripping, a fuel delivery, a storm cut-out.
  • For the waste-to-energy plant, stack emissions compared against the EU Industrial Emissions Directive limits.
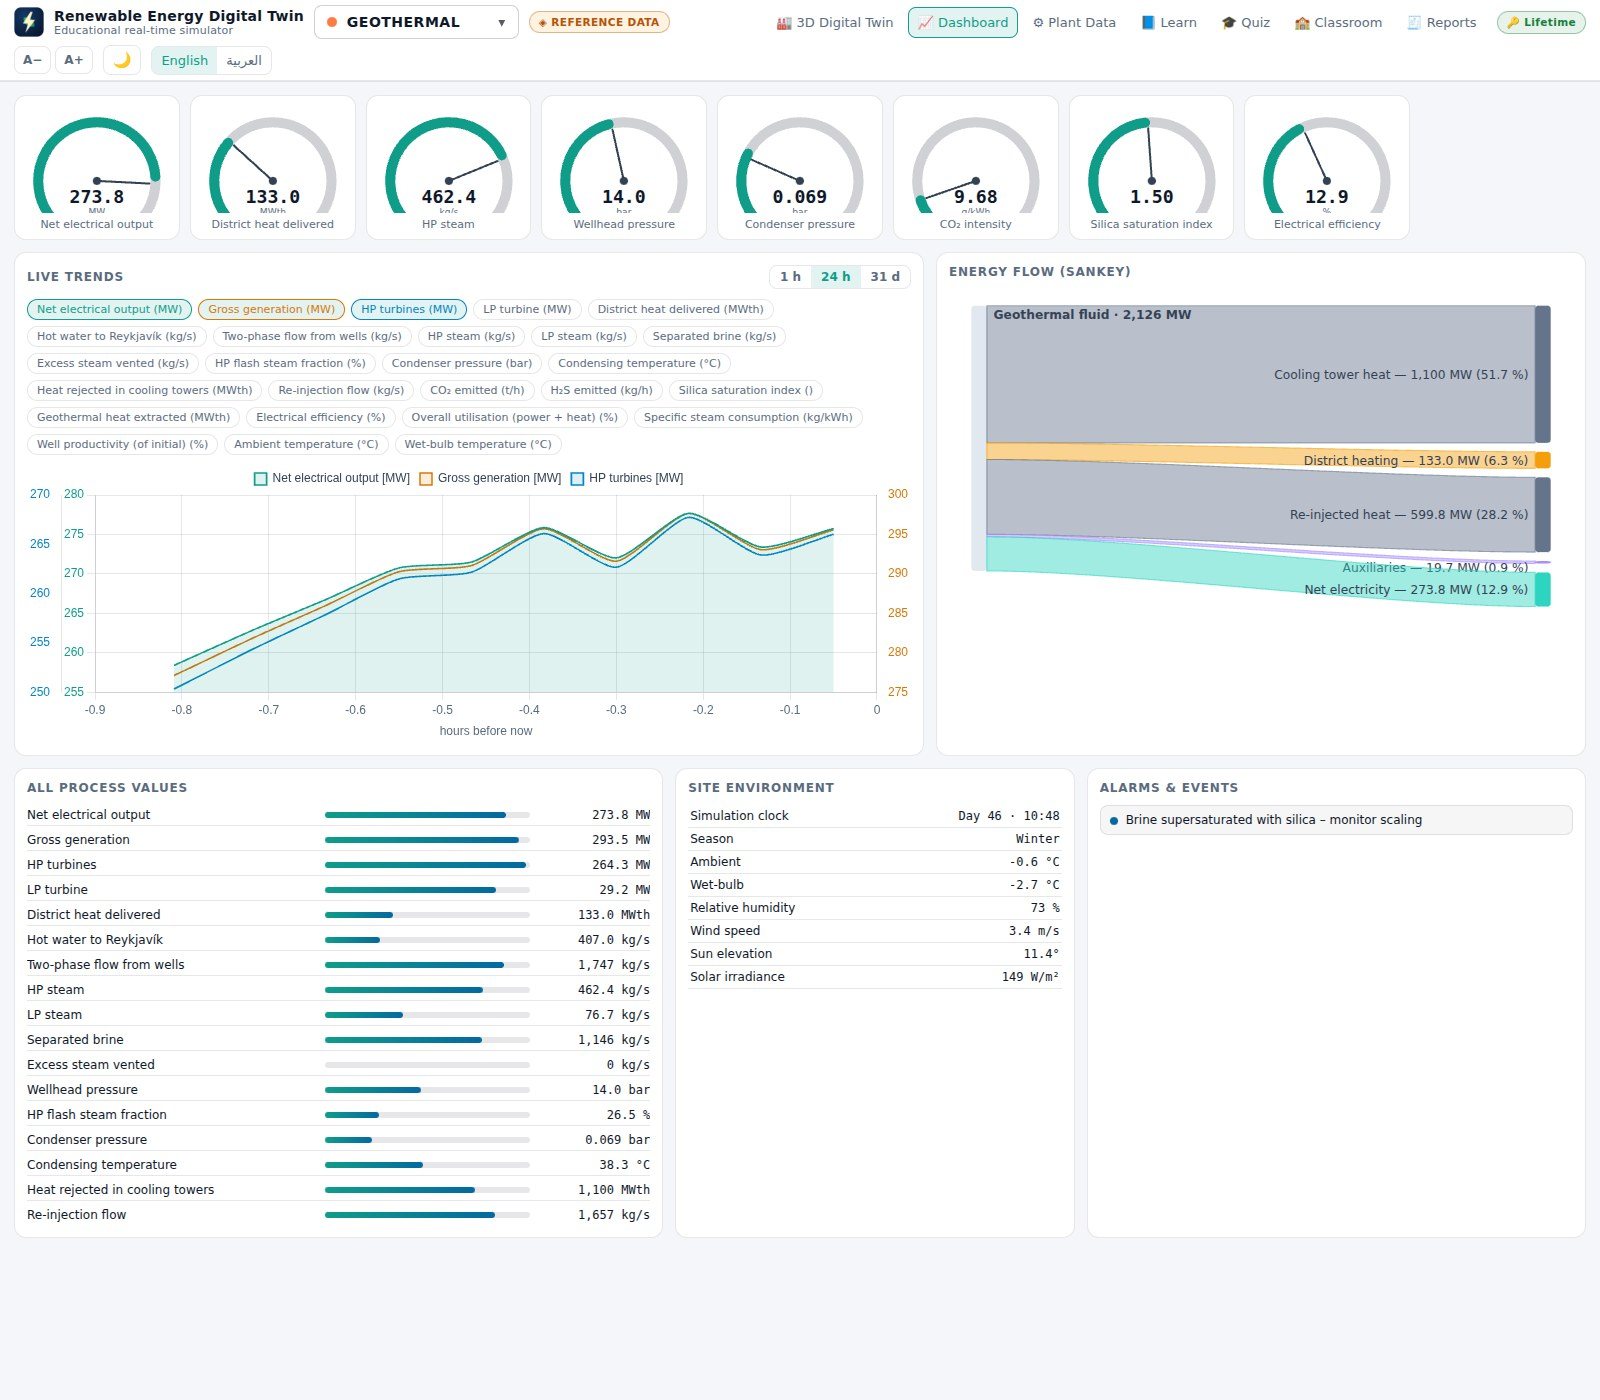
The dashboard of the geothermal plant with gauges, live trend charts, the Sankey energy flow diagram and the alarm list
Gauges, live trends, energy flow and alarms — updated every second.
Plant Data & scenarios

Take control of the physics model

Every operating parameter is listed in groups with its reference value from the real site, a short explanation, a slider and a sensible range. Type a new number and the 3D twin, the dashboard and even the quiz questions change with it — the badge at the top switches from REFERENCE DATA to USER DATA so you always know which you are looking at.

  • Ready-made scenarios that tell a story: drought or record flood at the dam, wet fuel or a port strike at the biomass plant, a summer heatwave, a dust storm, a storm with turbine cut-out, aged electrolysers, a grid curtailment order, a flue-gas treatment failure.
  • Reset one parameter, or the whole plant, back to reference data in one click.
  • Export a data set as JSON to keep several cases, hand in an exercise or share a set-up with colleagues; import it back later.
  • A data sheet for the real plant alongside: location, operator, commissioning date, installed capacity and the public sources the reference values came from.
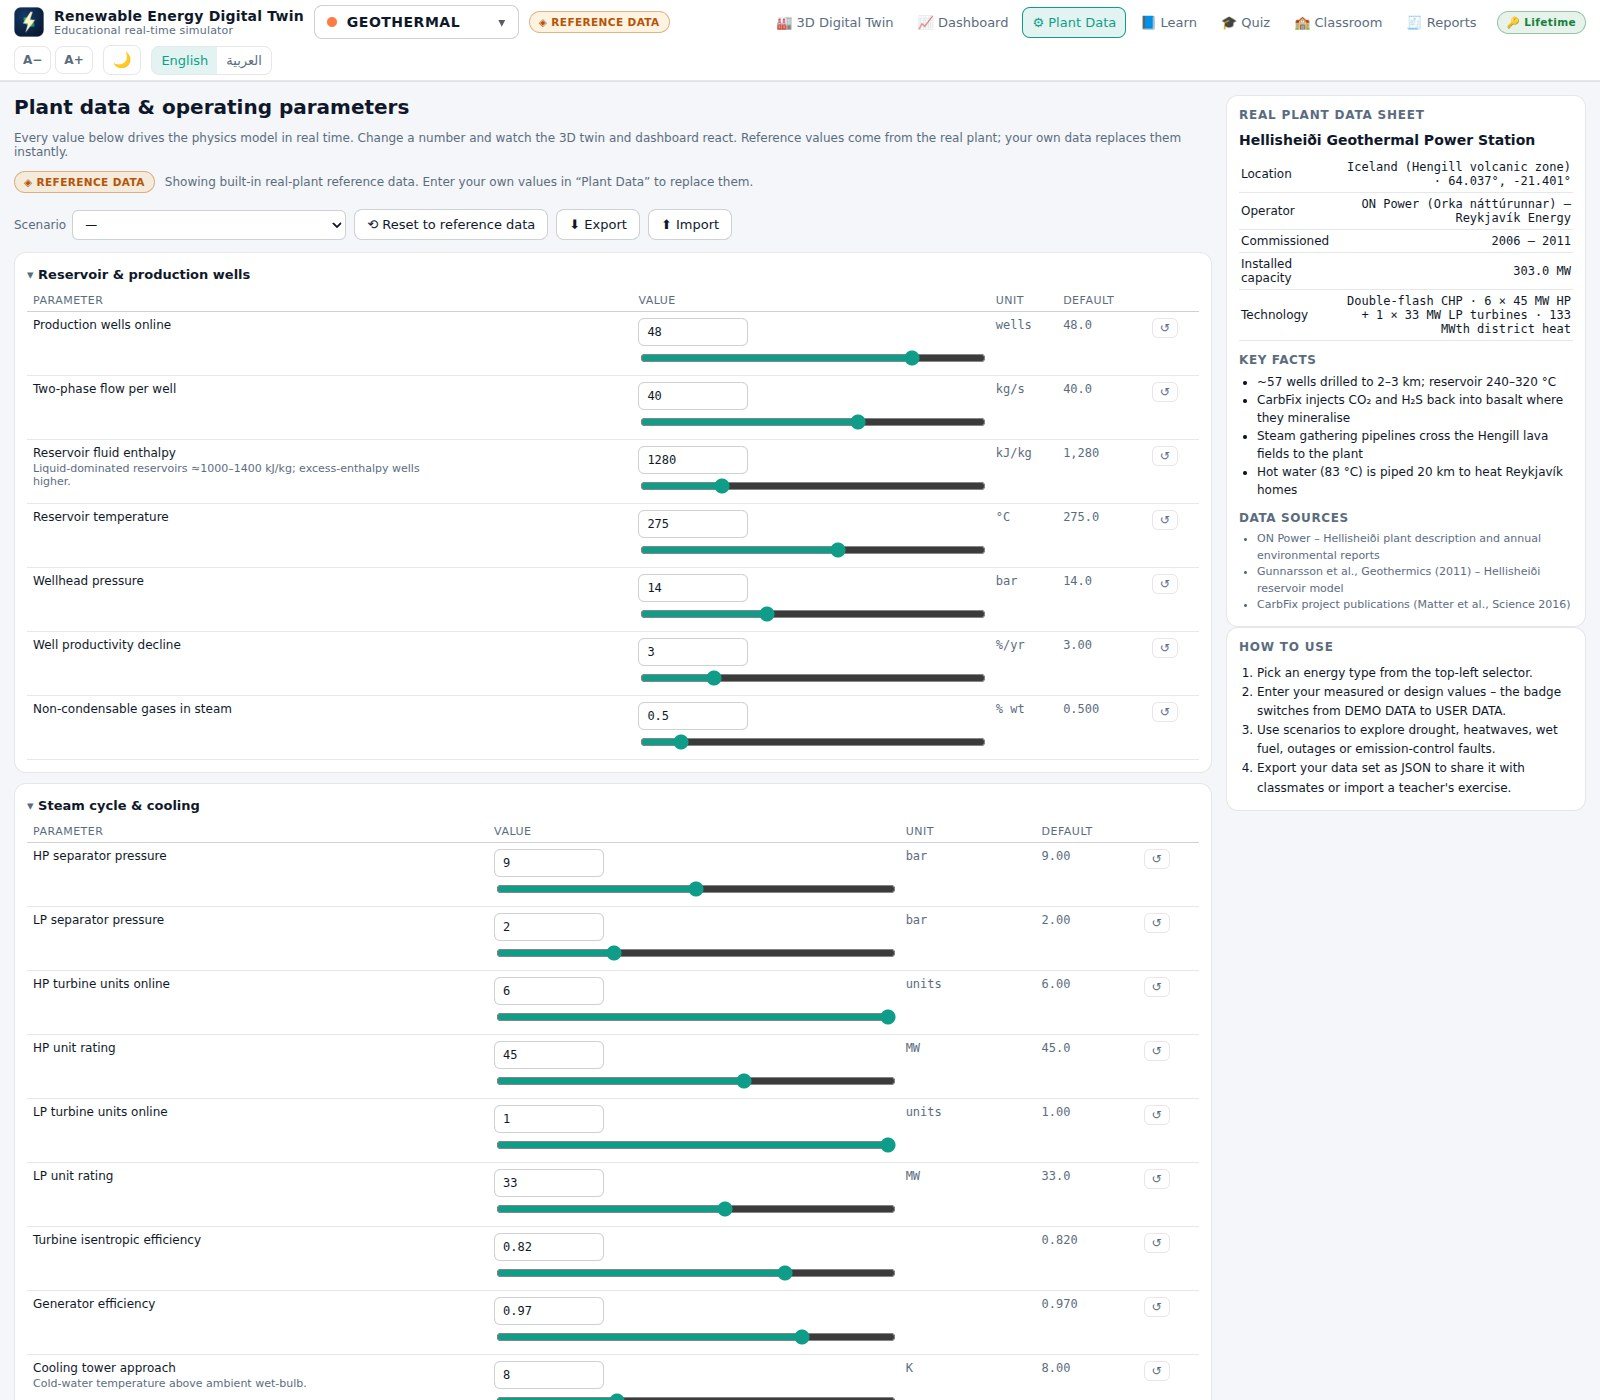
The Plant Data page with editable parameters grouped on the left and the real plant data sheet on the right
Parameters in groups on the left, the real plant's data sheet on the right.
Learn

A course that points at the running model

Each technology gets its own Learn page: what the plant does and why the technology matters, the process from resource to grid one step per component, the equations behind the model, the reference plant's data sheet, an environment and sustainability section, and a plain-language glossary.

  • Every process step has a Show in 3D button that flies the camera to that component in the live twin.
  • The real equations — energy balances, efficiencies, power curves, the Betz limit, flash fractions, Faiman cell temperature, turbine hill charts — with every symbol explained.
  • Available in the trial version, in both languages.
A Learn page in Renewable Energy Digital Twin with an overview, the process step by step and jump links at the top
Overview, process, equations, real data, environment and glossary.
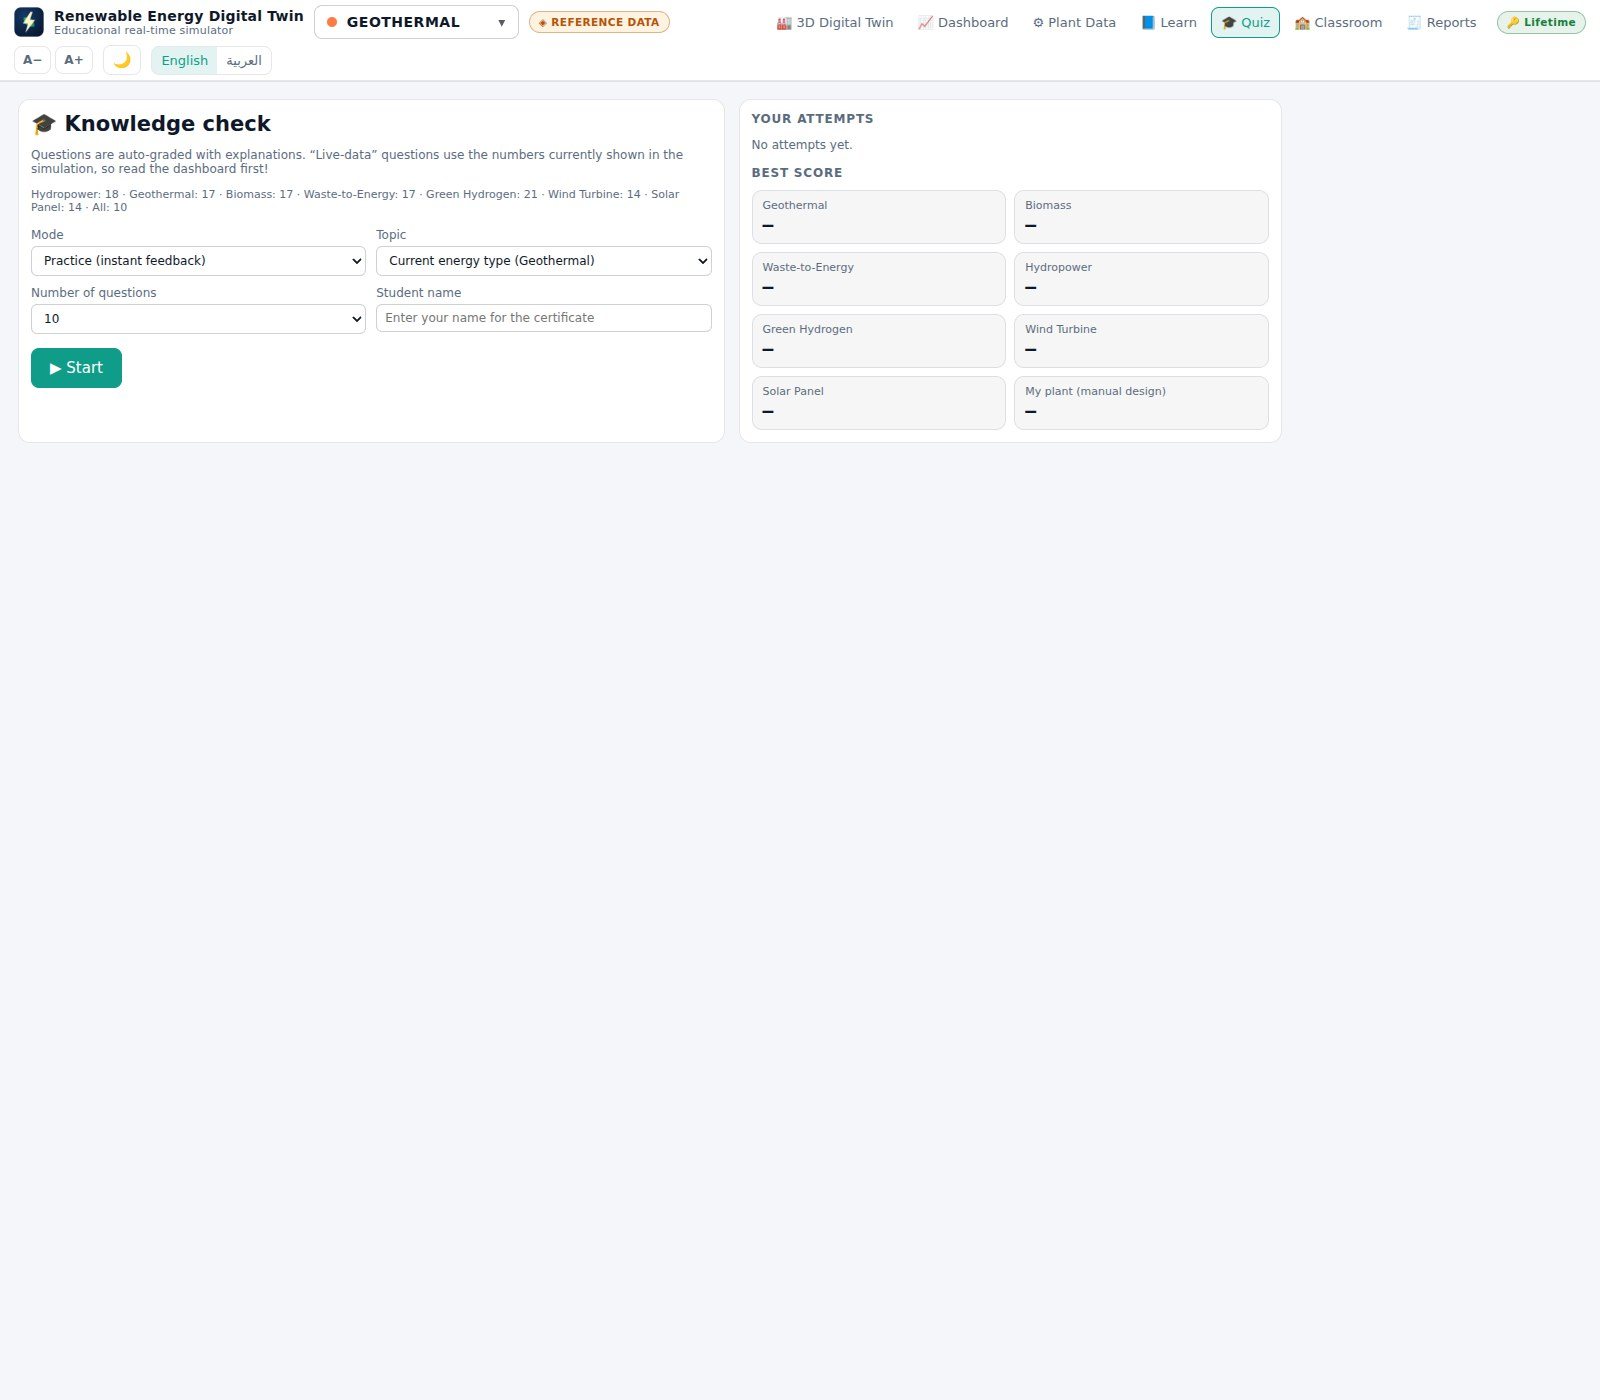
Quiz

Practice, exam, and questions that read the simulation

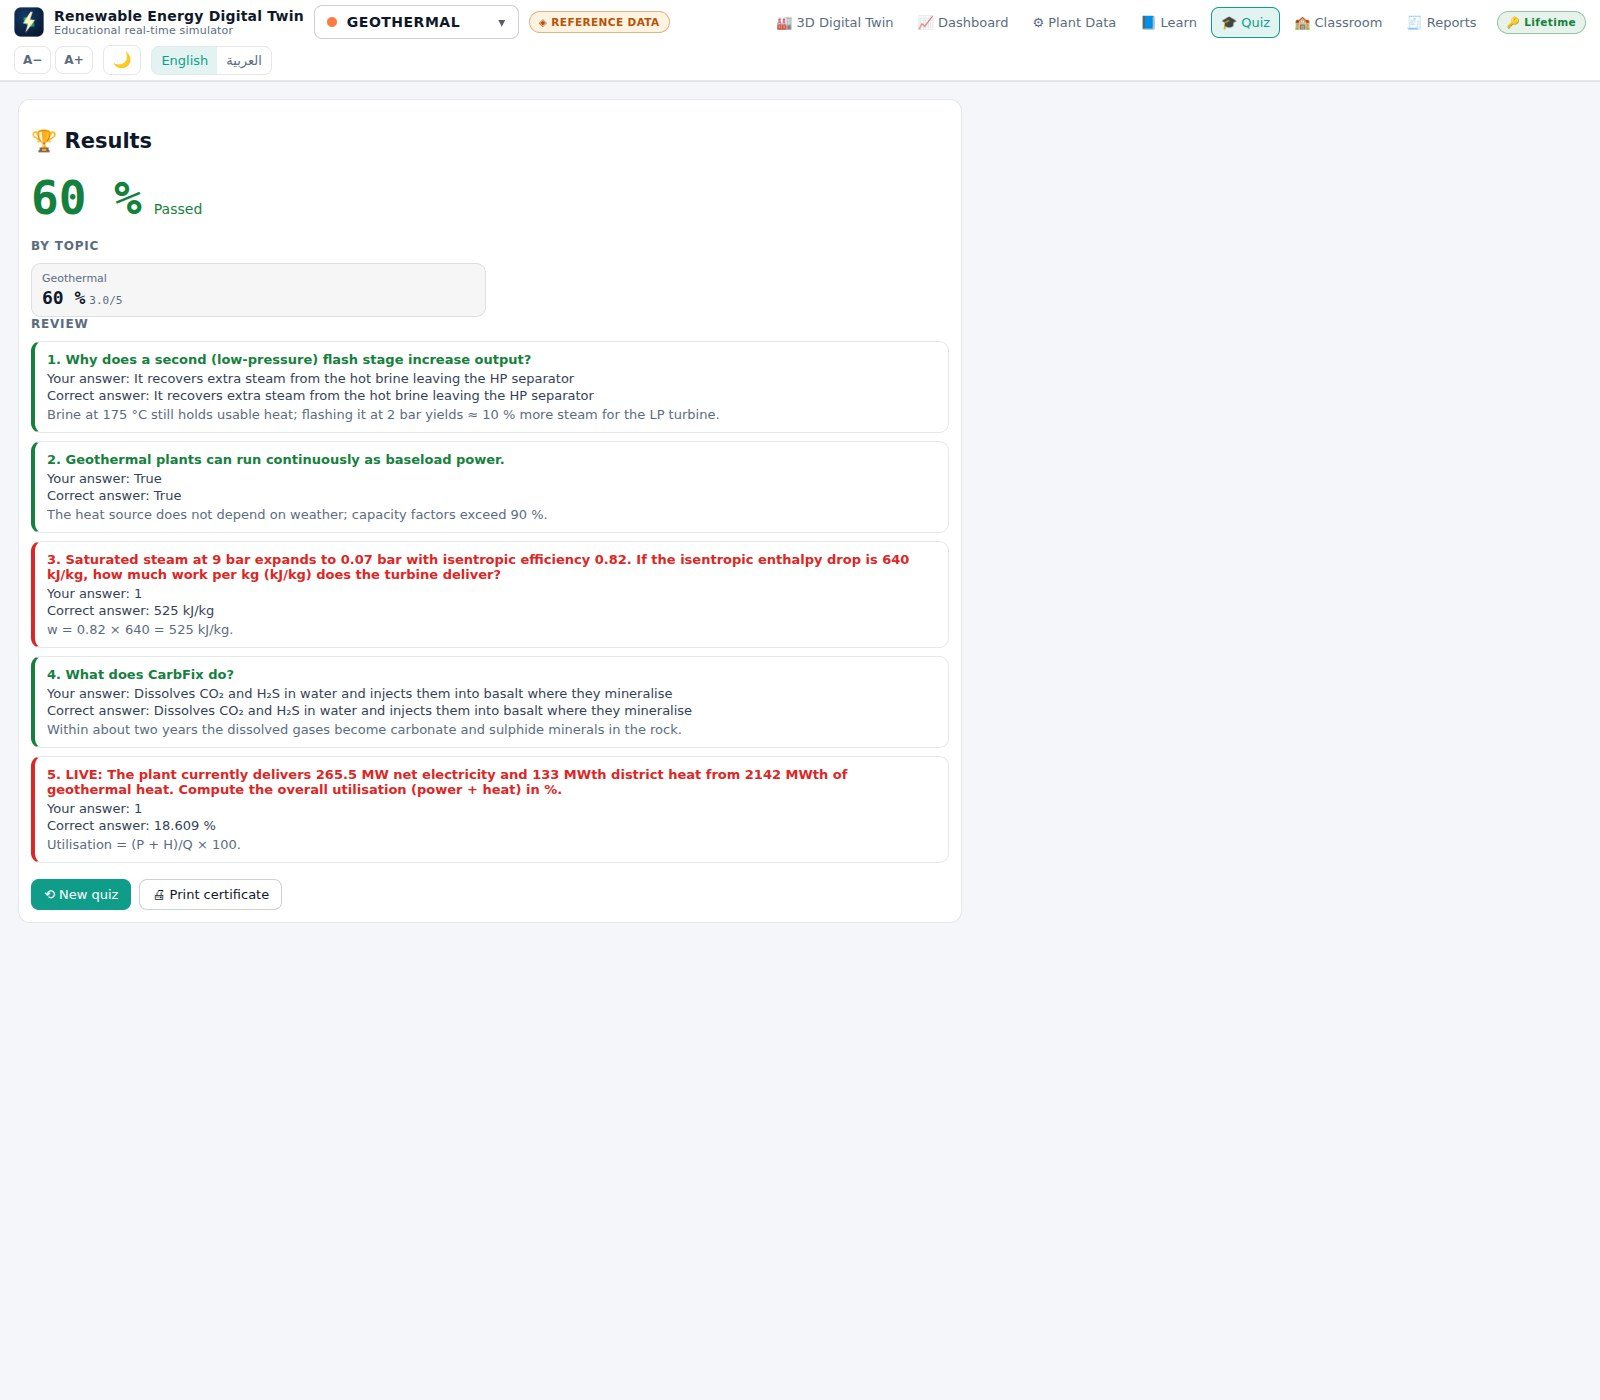
Choose practice mode for immediate feedback with explanations, or exam mode with a 90-second timer per question and no feedback until the end. Pick 5, 10, 15 or 20 questions from the open plant or from all seven.

  • Single choice, true/false, multiple selection with partial credit, and numeric answers accepted within a tolerance.
  • LIVE DATA questions take their correct answer from the simulation at the moment the quiz started — so students also learn to read the dashboard.
  • 60 % is a pass; the results page breaks the score down by topic and reviews every question with the explanation.
  • A printable certificate after a pass, and a history of past attempts with the best score per energy type.
The quiz results page showing the score, the pass mark, a breakdown by topic and a review of every question
Score, pass mark, breakdown by topic, and a full review of every answer.
Classroom mode

Follow a whole class — with no server and no internet

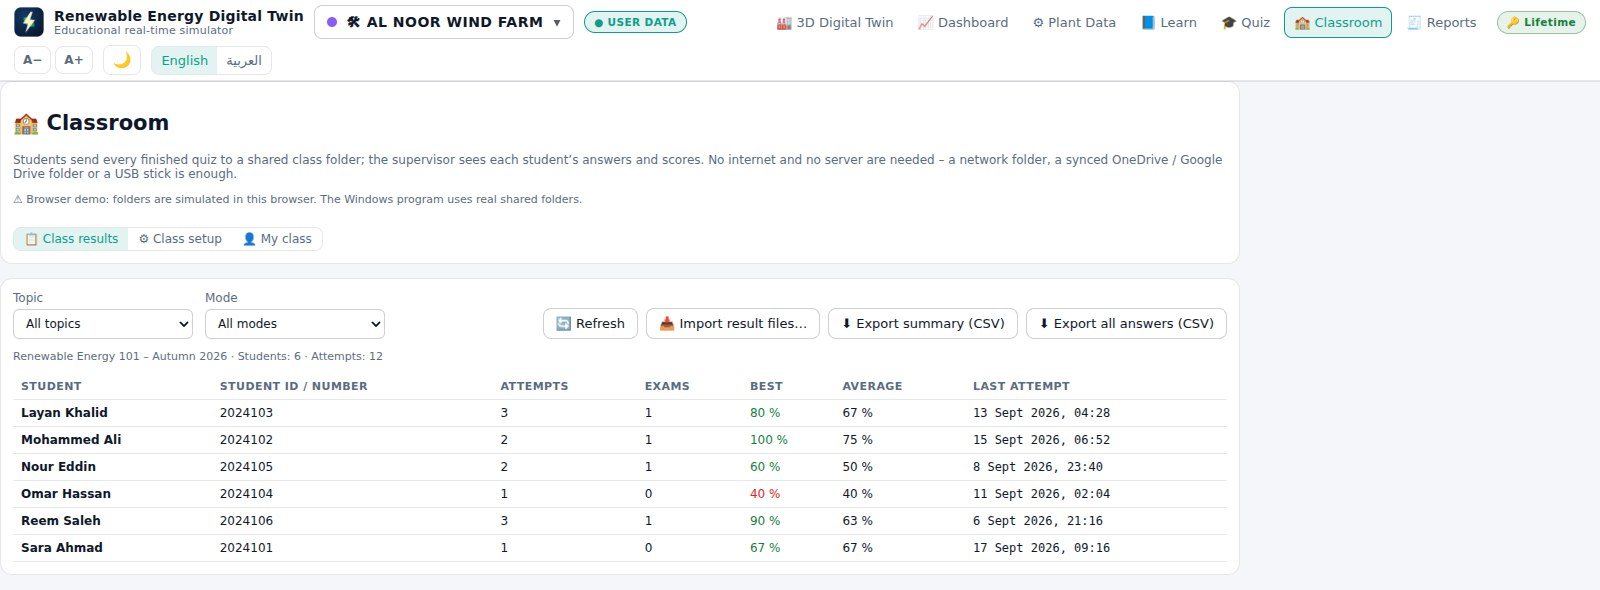
The supervisor creates a class in any folder every computer can reach: a shared network drive, a synced OneDrive or Google Drive folder, or even a USB stick passed around. Students join it once, and every quiz they finish is written into that folder with all their answers.

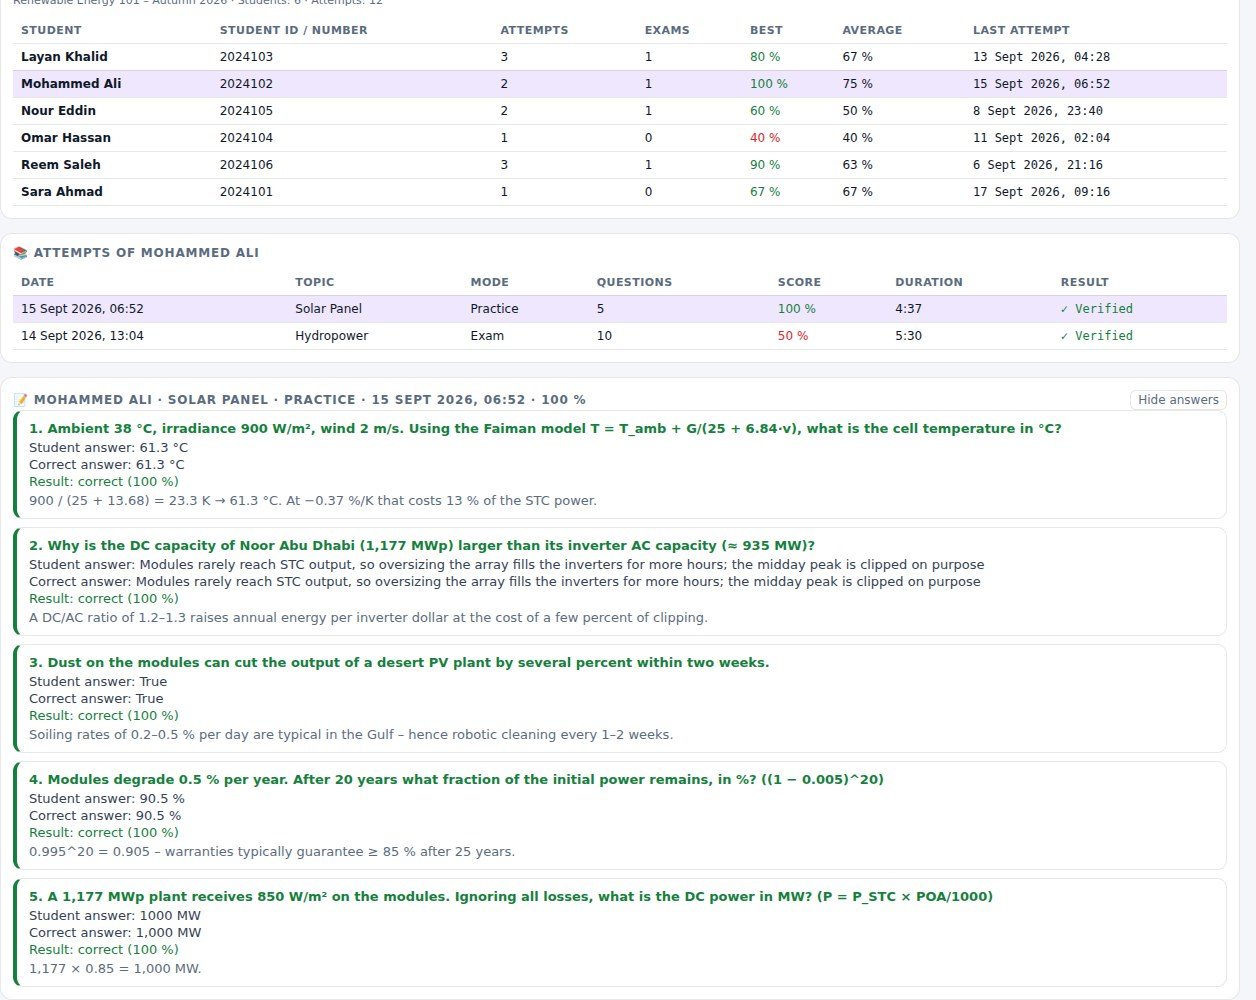
  • One row per student with attempts, exams, best and average score — click through to any single answer.
  • Every result file is signed with the class key, so a file modified afterwards is flagged and excluded from the averages.
  • Results kept on the laptop when the folder is offline, then sent when it is reachable again.
  • Export the summary or every answer as Excel-compatible CSV, with Arabic and English text intact.
The Class results table with one row per student showing attempts, exams, best and average score
Class results: one row per student, with every attempt one click away.
The attempts of one student and the detail of a single attempt, showing every question, the student's answer and the result
One attempt in detail: every question, answer, correct answer and explanation.
Build your own plant

Your design, turned into a working twin

A wind farm you are planning, the solar plant of your city, a hydropower project from a case study, a hypothetical hydrogen plant — choose the technology, enter the few design values that define it, and the program derives everything else, builds the 3D model to match your numbers and runs the physics on them.

  • Seven climate presets set the weather, sun and wind statistics and the look of the terrain — from the Gulf desert to sub-arctic Iceland.
  • Wind farms take turbine count, rated power, rotor diameter, hub height, mean wind speed, site elevation, cost and sale price; each technology has its own short list.
  • Learn pages, quizzes and reports then follow your plant, not the reference one.
  • Add coordinates and your plant gets real satellite imagery under it too.
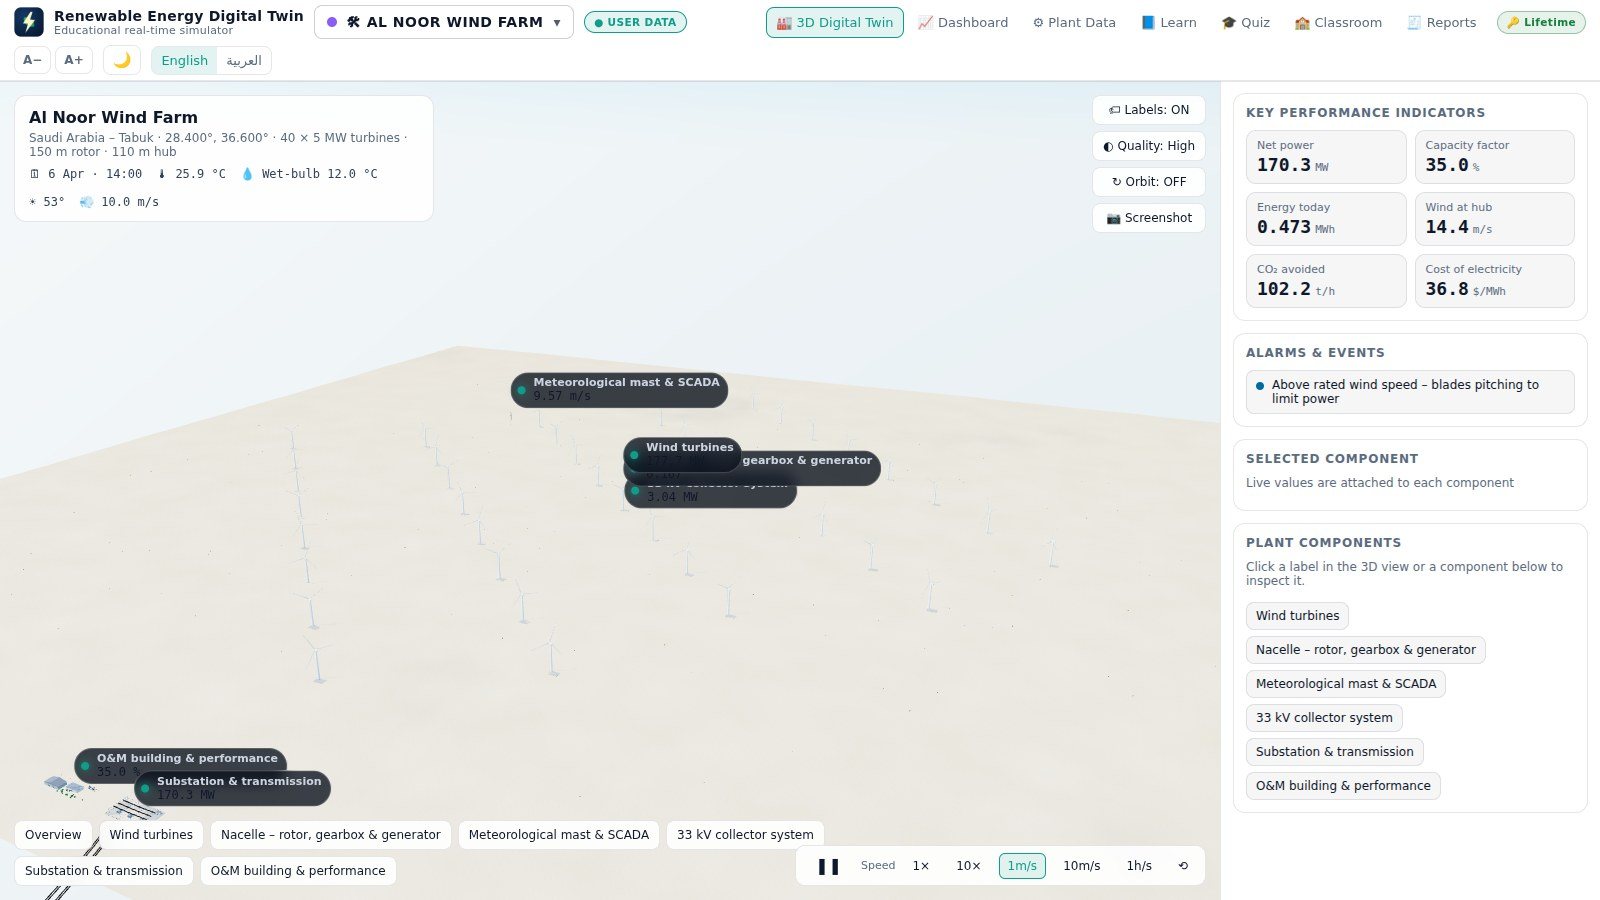
The generated 3D twin of a 40-turbine wind farm designed in the manual plant builder
A 40-turbine wind farm designed in the wizard, generated as a running twin.
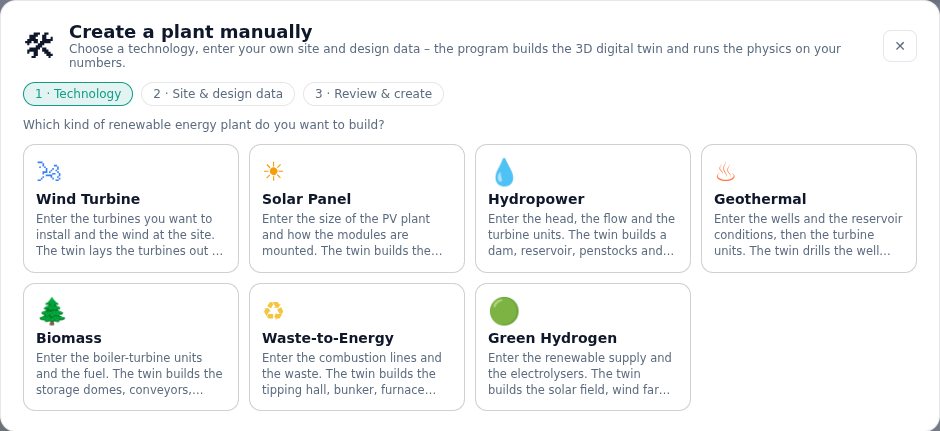
Step one of the plant builder: choosing one of the seven technology cards
Step 1 — choose the technology.
Reports & export

Document exactly what you saw

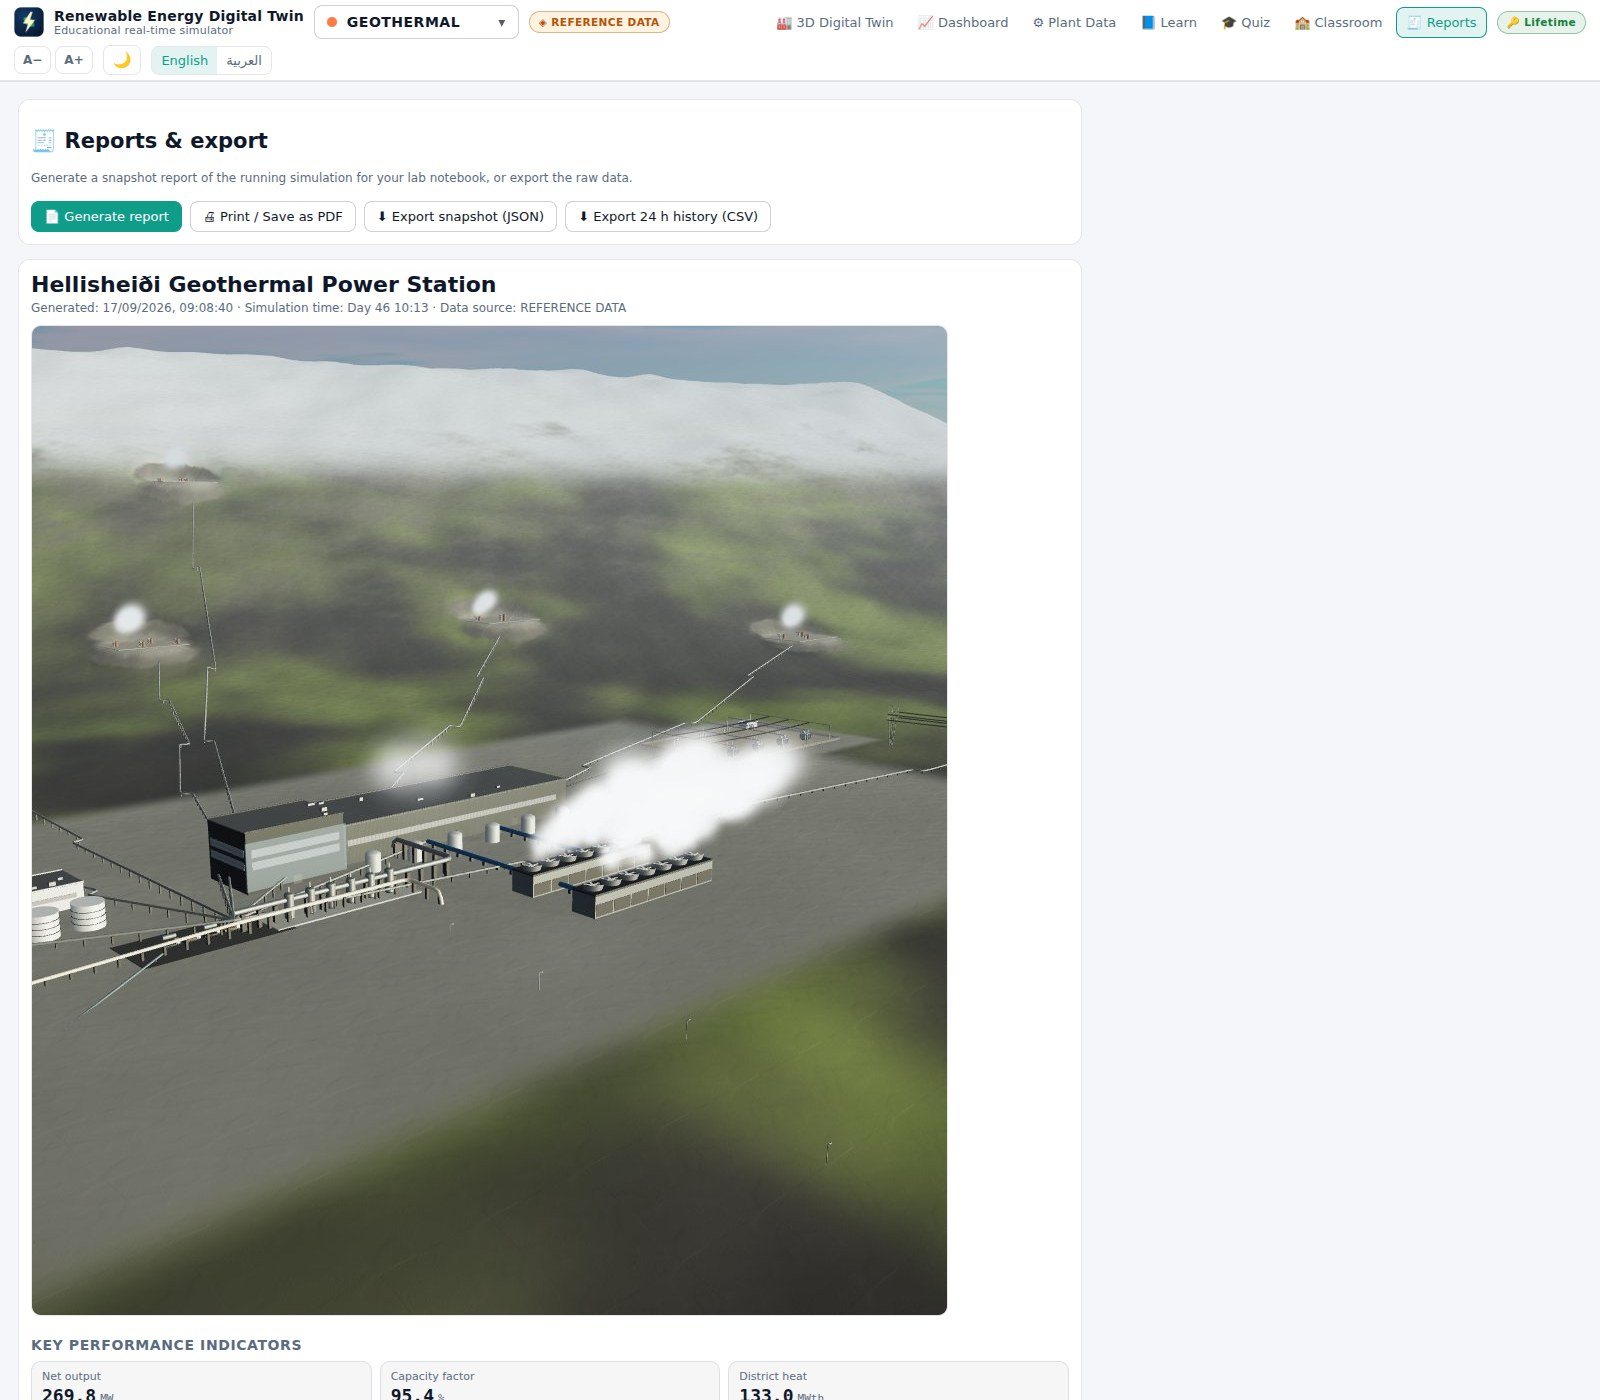
One click builds a report of the running simulation: plant name, generation time, simulation time, whether it used reference or user data and which scenario, a picture of the 3D twin, the KPIs, the active alarms, every process value, every parameter with the changed ones marked, and your quiz performance.

  • Print it, or save it as PDF with Microsoft Print to PDF.
  • Export the current state as JSON, or the last 24 simulated hours of every value as CSV for Excel.
  • Ideal for a lab notebook, a homework hand-in or a presentation.

A generated report in Renewable Energy Digital Twin with a picture of the 3D twin, the KPIs, alarms and all process values
A generated report, ready to print or save as PDF.
The seven reference plants

Real sites, real published data

Each plant is modelled from its operator's published figures, and each one comes with its own physics model, learn pages, scenarios and quiz bank.

The 3D twin of Hellisheidi geothermal power station: well pads on the Hengill lava fields, gathering pipelines, separators, turbine hall and cooling towers
Geothermal

Hellisheiði Power Station

Iceland — a double-flash CHP plant on the Hengill volcanic zone, with well pads, gathering pipelines, separators, a turbine hall and CarbFix re-injection.

303 MW + 133 MWth district heat

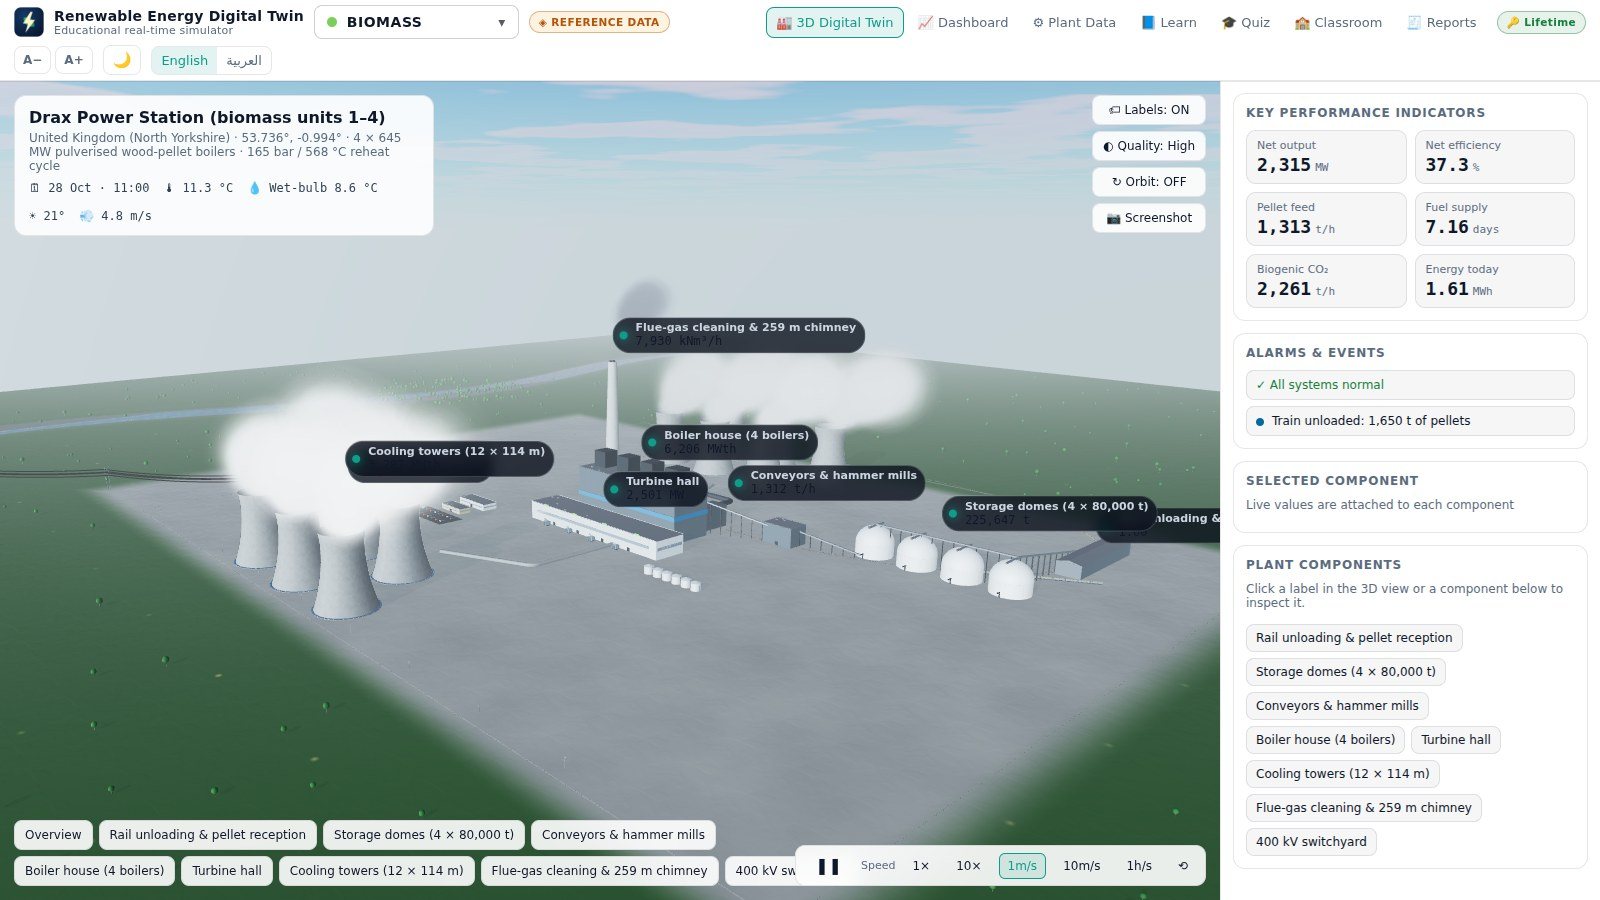
The 3D twin of Drax power station: rail unloading, four storage domes, boiler house, turbine hall, twelve cooling towers and the chimney
Biomass

Drax Power Station

United Kingdom — biomass units 1–4, with rail unloading, four storage domes, the boiler house, twelve cooling towers and a 259 m chimney.

2,580 MW

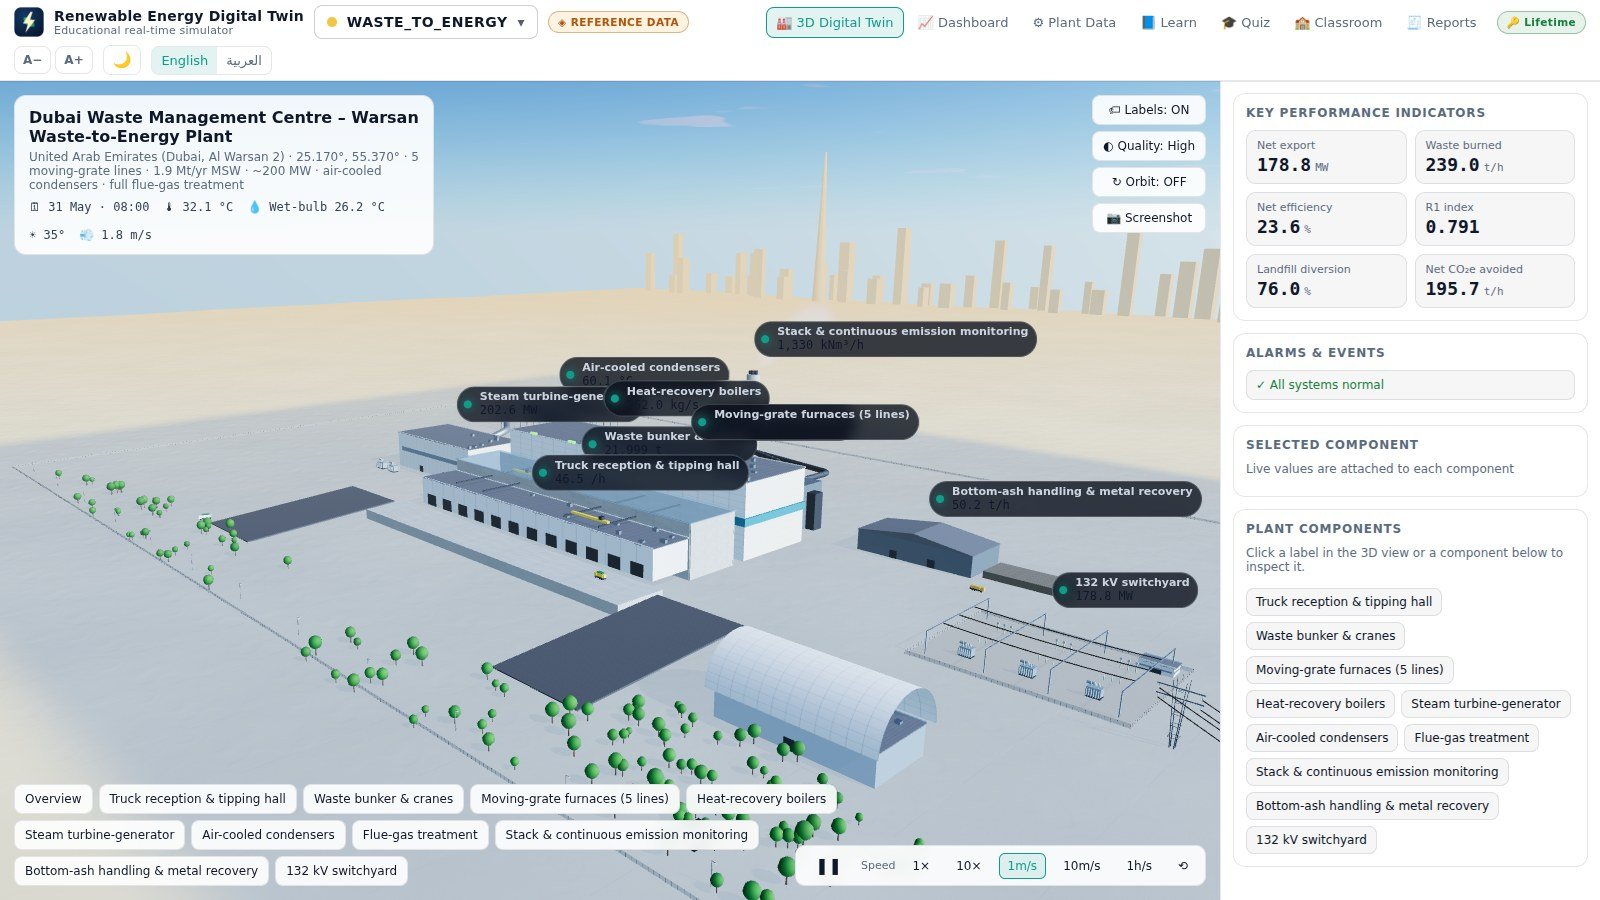
The 3D twin of the Warsan waste-to-energy plant in Dubai: tipping hall, waste bunker, five furnace lines, flue-gas treatment and stack
Waste to energy

Dubai Waste Management Centre

Warsan, UAE — tipping hall, waste bunker, five furnace lines, advanced flue-gas treatment and air-cooled condensers.

200 MW · 1.9 Mt waste/year

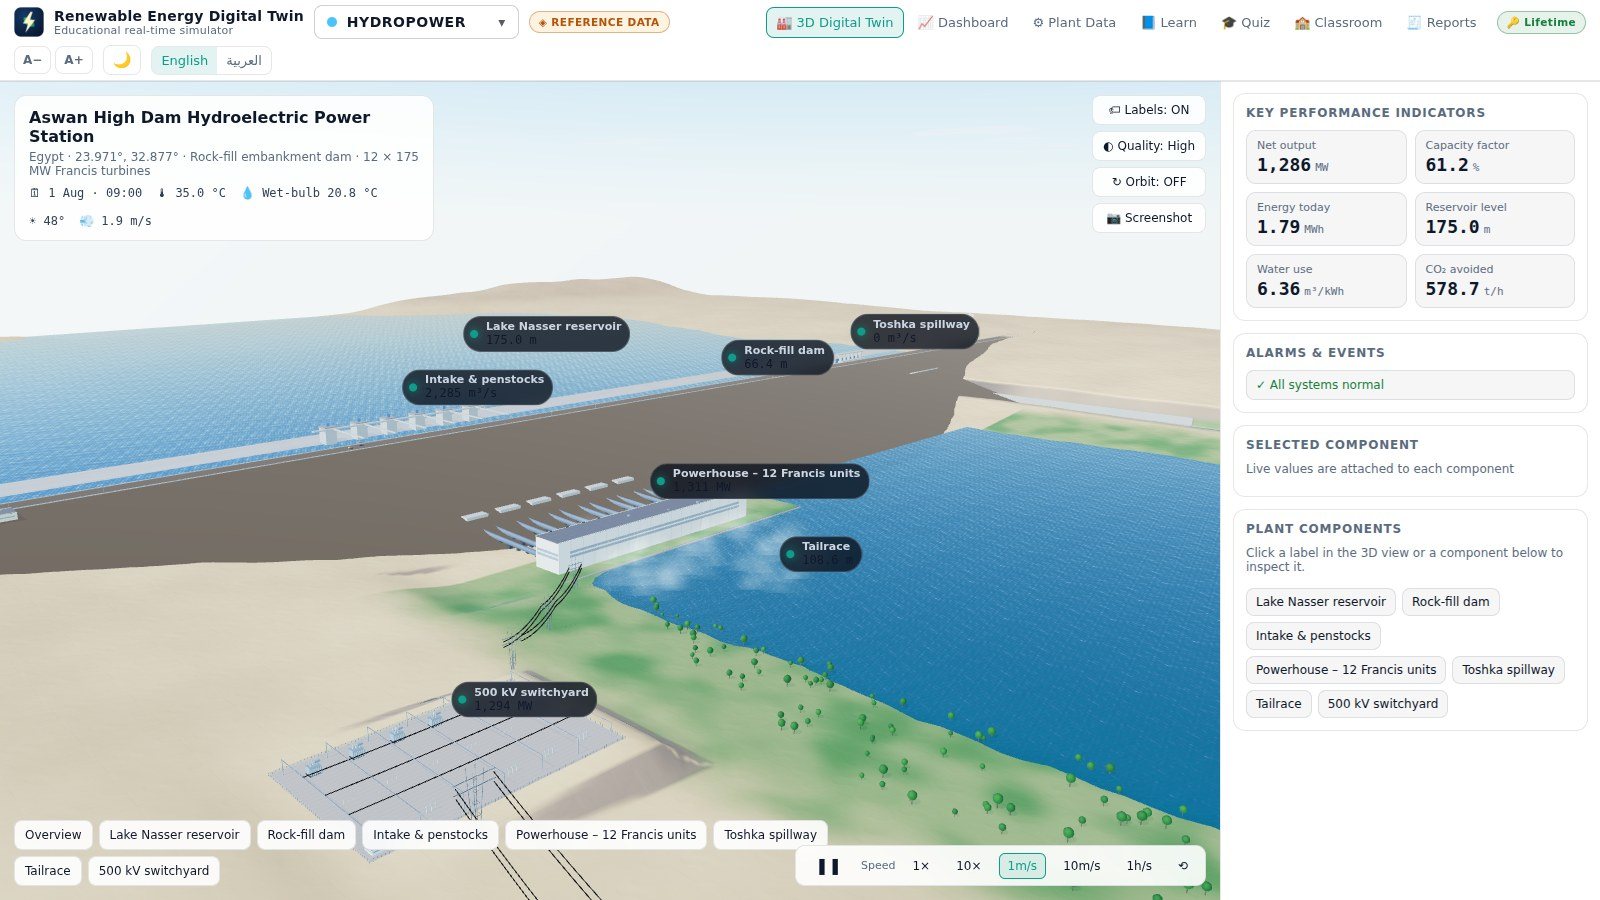
The 3D twin of the Aswan High Dam: Lake Nasser, the rock-fill dam, intakes and penstocks and the powerhouse with twelve Francis units
Hydropower

Aswan High Dam

Egypt — Lake Nasser, the rock-fill dam, the intakes and penstocks, and a powerhouse with twelve Francis units.

2,100 MW

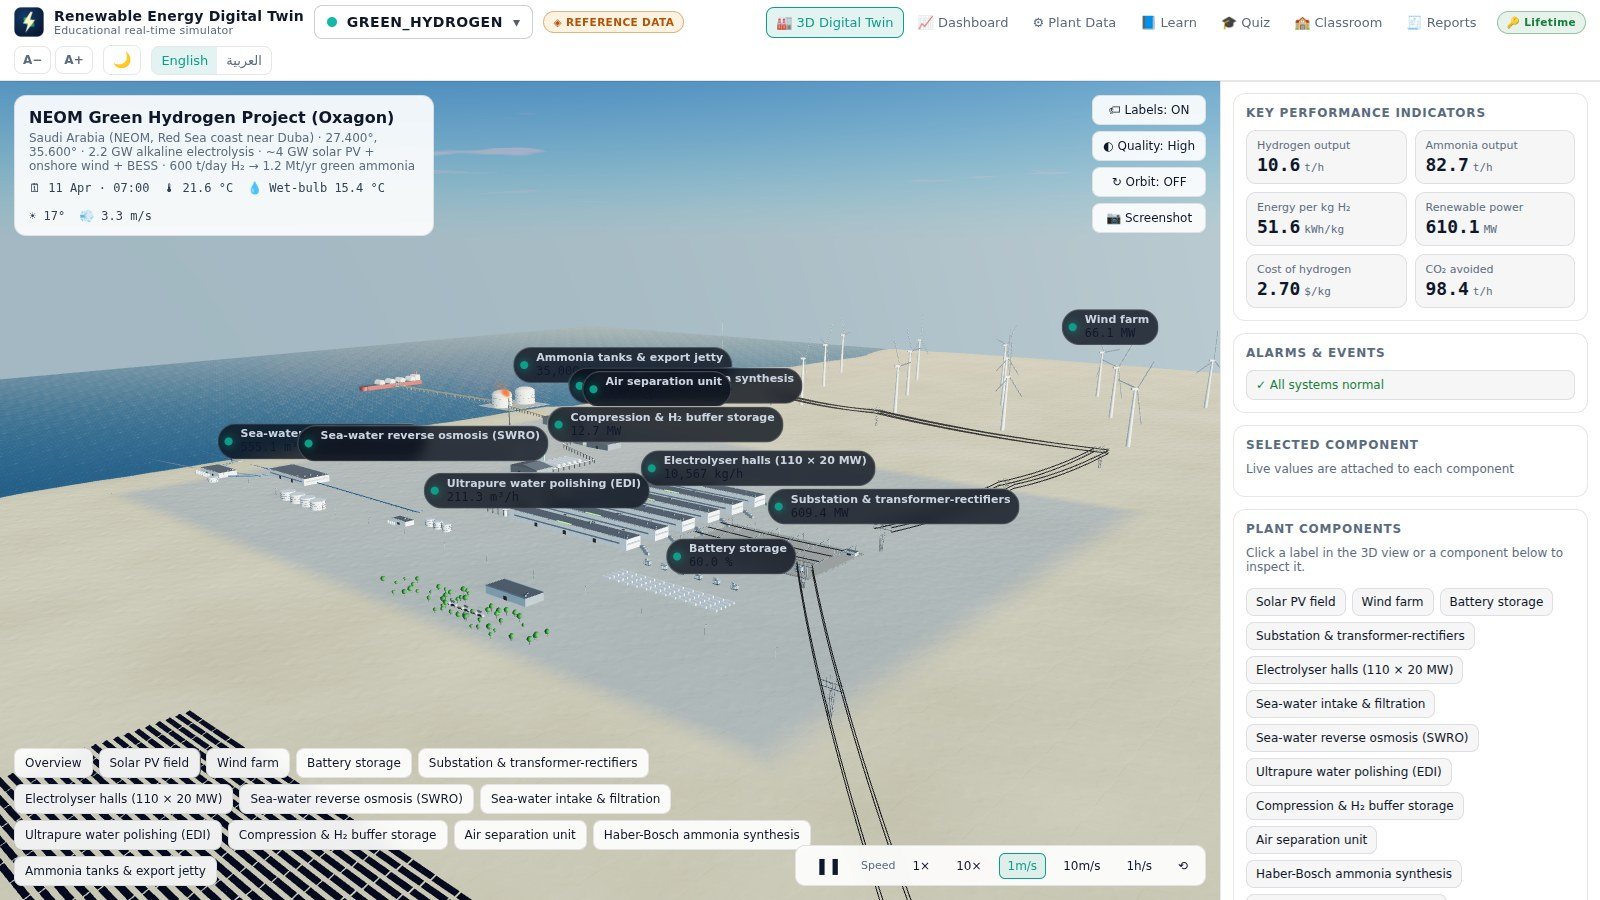
The 3D twin of the NEOM green hydrogen project: solar field, wind farm, battery storage, electrolyser halls, water treatment and hydrogen storage
Green hydrogen

NEOM Green Hydrogen Project

Oxagon, Saudi Arabia — solar field, wind farm, battery storage, electrolyser halls, sea-water treatment and ammonia synthesis.

2.2 GW electrolysis · 600 t H₂/day

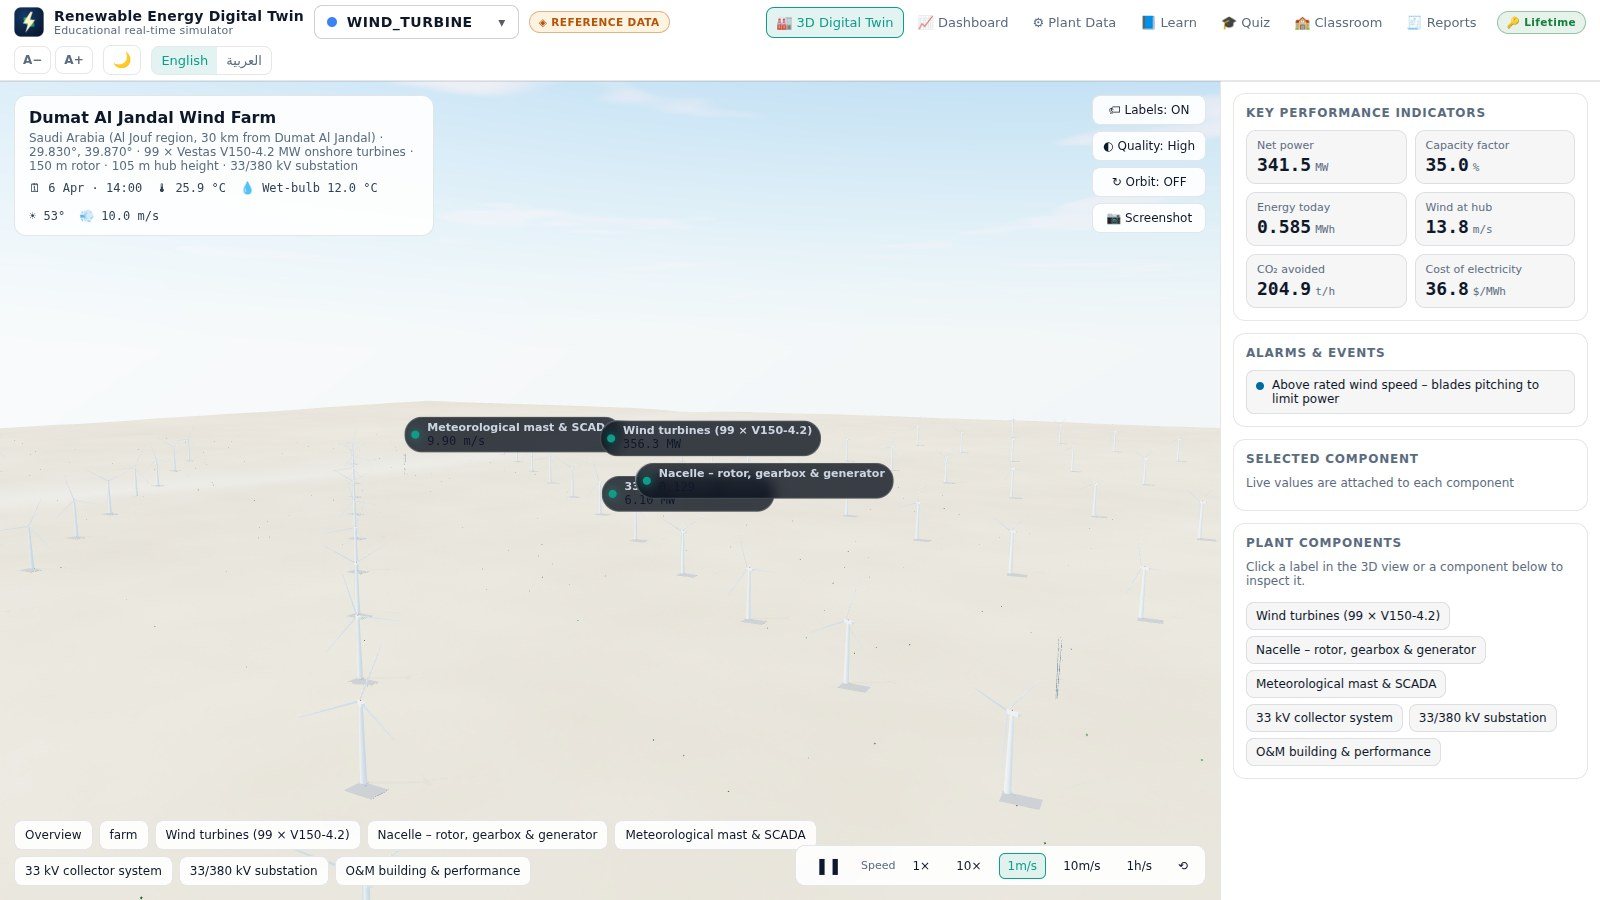
The 3D twin of Dumat Al Jandal wind farm: 99 turbines in rows across the prevailing wind, with the meteorological mast and collector system
Wind

Dumat Al Jandal Wind Farm

Saudi Arabia — 99 turbines laid out in rows across the prevailing wind, with the met mast, collector system and substation.

400 MW · 99 turbines

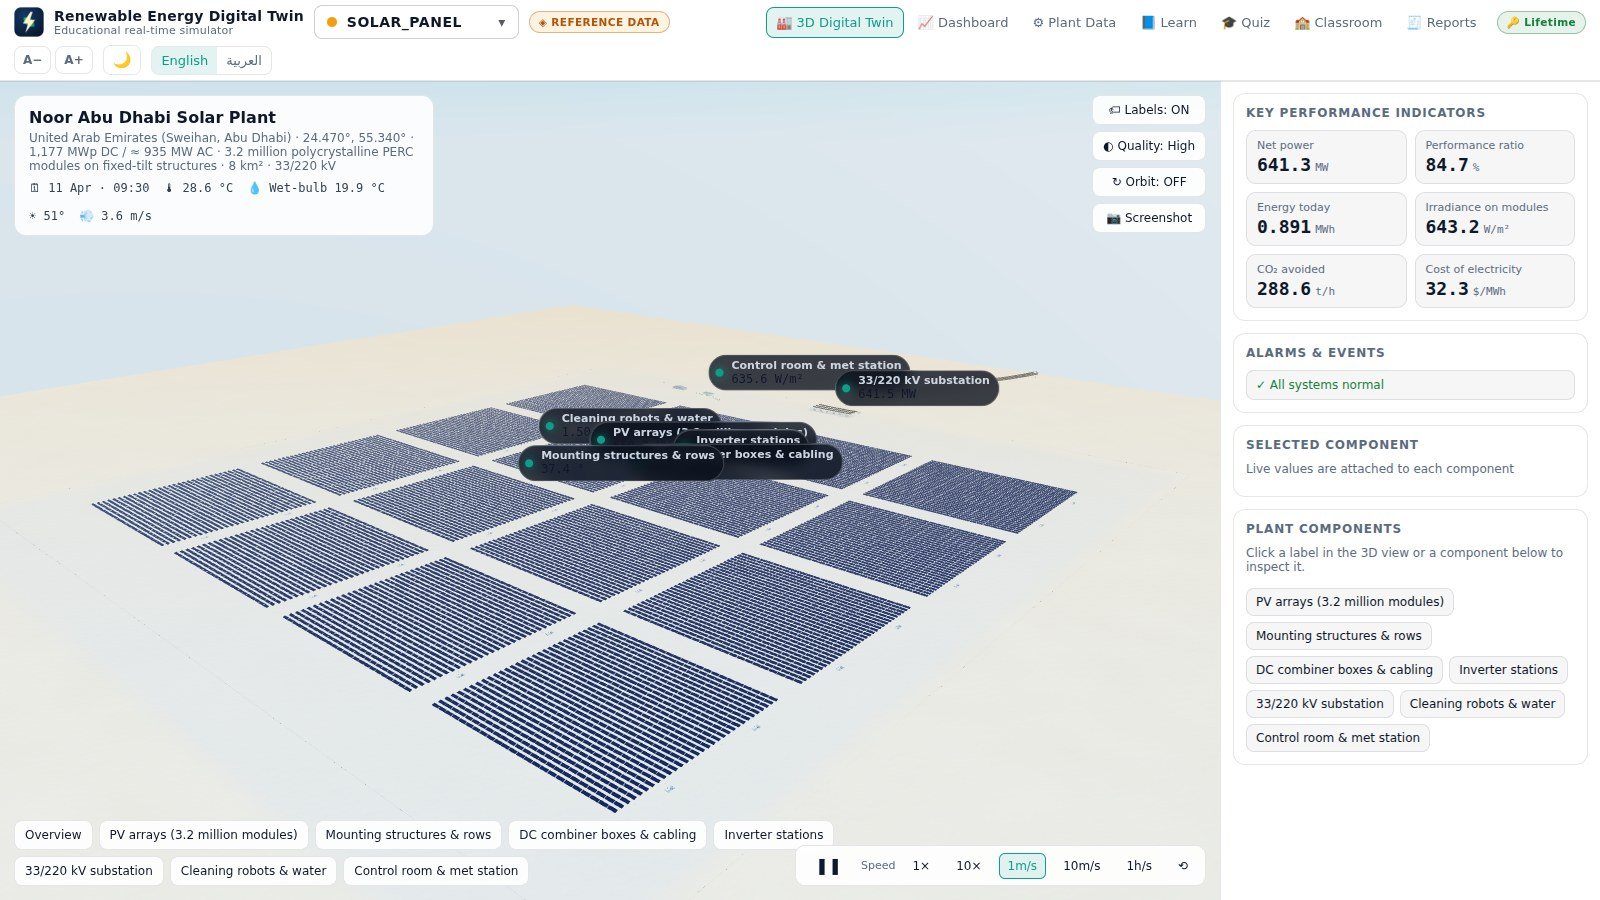
The 3D twin of Noor Abu Dhabi solar plant: PV arrays on fixed-tilt structures, inverter stations, substation and cleaning robots
Solar PV

Noor Abu Dhabi Solar Plant

United Arab Emirates — PV arrays on fixed-tilt structures with inverter stations, a substation, cleaning robots and the met station.

1,177 MWp

Screenshots

See it before you install it

Real screens from version 1.4.0.

How it works

Installed in about twenty seconds

No administrator password, no database, no server — and nothing you do during the trial is lost when you activate.

Download & install

Run the setup file. It installs into your own Windows profile in about twenty seconds, creates a desktop shortcut and starts the program. A portable edition that runs from a USB stick is also available.

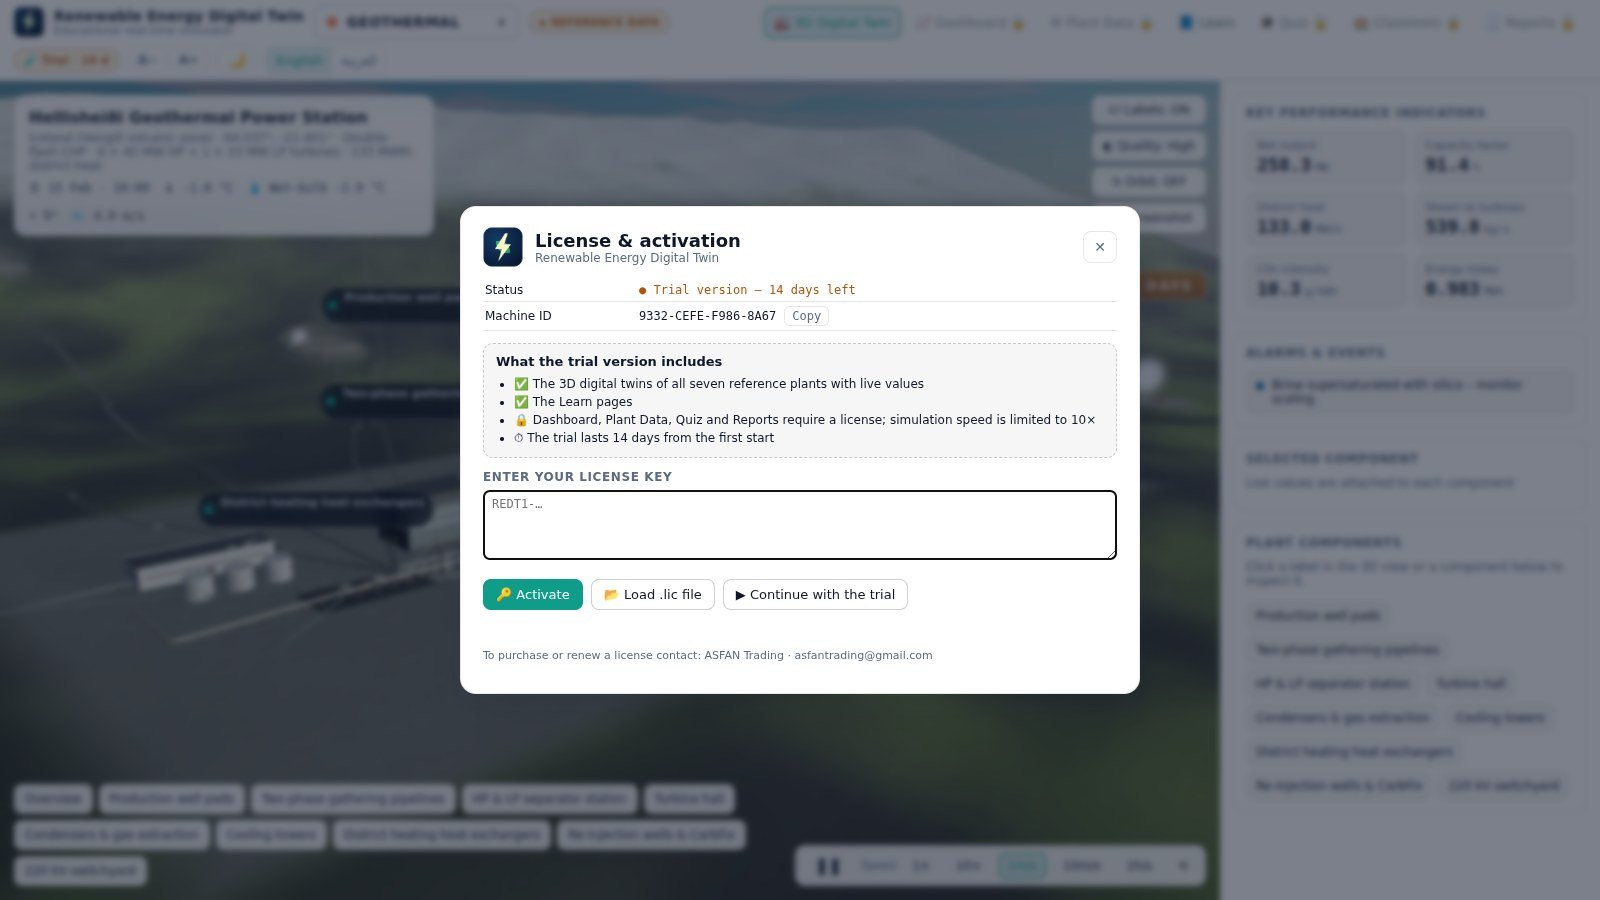
Explore with the 14-day trial

Click Continue with the trial and all seven 3D twins and every Learn page are open to you immediately, with the simulation running up to ten times real time.

Activate your license

Paste the key we send you — it starts with REDT1- — or load the .lic file. Activation is checked on your own computer, so no internet connection is needed.

Open in the 14-day trial
All seven 3D digital twins with live values, camera presets, labels, day and night · every Learn page · language, text size and theme · simulation speed up to 10×
Unlocked by a license
Dashboard (gauges, charts, energy flow, alarms) · Plant Data, scenarios and import/export · Quiz and certificates · Reports and data export · simulation speeds 1 m/s, 10 m/s and 1 h/s · the manual plant builder · Classroom mode
When the trial ends
Enter a key to continue — nothing you did during the trial is lost

Start free, today

The trial lasts 14 days from the first start and needs no key, no payment details and no account.

  • Every 3D twin, running live
  • Every Learn page, in both languages
  • Locked pages show an Activate button instead of their content
Start the free trial
Licensing

Monthly or Annual — your choice

A license can cover all seven energy types or just the ones you teach. Supervisor licenses add the Classroom results table.

Not sure yet? Install the 14-day trial first — no key, no payment, no account.

Download Trial

Monthly

Time-limited access, renewed every month.

Contact us

for current pricing

  • Every page unlocked: dashboard, plant data, quiz, reports, builder
  • Your choice of energy types, or all seven
  • Free updates while the subscription is active
  • The badge warns you during the last 14 days
  • Ideal for a single semester or a pilot project
Request Monthly License

Teaching a class? Ask about the supervisor license and multi-seat pricing — contact us or message us on WhatsApp at +962 77 614 0404.

System requirements

Before you install

Operating system
Windows 10 or 11, 64-bit
Processor
Dual-core 2 GHz minimum · quad-core 2.5 GHz recommended
Memory
4 GB minimum · 8 GB or more recommended
Graphics
Any chip with WebGL 2 (Intel HD 500 series or newer). A dedicated GPU is needed for the High quality setting
Disk space
600 MB minimum · 1 GB recommended
Screen
1366 × 768 minimum · 1920 × 1080 recommended
Internet
Not required. Recommended for automatic updates and satellite imagery
User rights
Standard user — no administrator rights needed
Current version
1.4.0, with automatic updates

Full user manual

65 pages covering every screen, all seven plants and the plant builder.

FAQ

Common questions

Engineering and energy students, universities, technical institutes, training centres and practising engineers who want to see how a renewable plant behaves before they meet one. It is an educational product: the models are simplified and rely on typical parameters per technology, not live operating data.

All seven 3D digital twins with their live values, camera presets and day/night lighting, every Learn page, the language, text-size and theme settings, and simulation speeds up to 10×. The dashboard, Plant Data, quiz, reports, the plant builder and Classroom mode unlock when you enter a license key.

Neither. The program runs entirely on the computer, the license is verified locally, and Classroom mode uses an ordinary shared folder instead of a server. Internet is only used for automatic updates and for the satellite imagery under the plants — without it, generated terrain is shown and nothing else changes.

Yes. A license can cover all seven technologies or a selection — useful if your course only covers wind and solar, for example. The others appear with a lock in the energy-type list, and the plant builder offers only the covered technologies. A license can be extended later with a new key.

With a supervisor license the teacher creates a class in a shared folder — a network drive, OneDrive, Google Drive or even a USB stick. Students join it once, and every finished quiz is written there with all its answers, signed so that a tampered file is detected. The Classroom page then shows one row per student, with every attempt and every answer, and exports to CSV.

Yes — a portable edition runs directly from any folder, a USB stick or a shared drive. It shares its settings, license and data with the installed edition, but it cannot update itself, so you download newer versions by hand. Ask us if you need it.

That is the standard notice for an installer Windows has not seen many times before — it means the file is new, not that it is dangerous. In Edge click ⋯ → KeepShow moreKeep anyway; in Chrome click Keep; and on the blue SmartScreen window click More info then Run anyway. Chapter 4 of the manual shows each step with pictures.

Updates replace the program in place and keep your license, settings, entered plant data and quiz history. Uninstalling also keeps the data folder so that a later reinstallation carries on where you left off. Keep the e-mail or .lic file with your key — you need it again after reinstalling Windows or moving to another computer.